Here is how to make sense of the extended LUNA price consolidation
- LUNA price's mundane action leaves investors bored and yearning for a breakout.
- A dwindling Social Volume suggests investors are taking a hands-off approach with LUNA.
- LUNA price is largely in bears' hands and could pull back to the 200-day SMA.

The bear market has been tough on LUNA price – way more on other cryptocurrencies. In addition to losing nearly 100% of its value during the crash in May, the token powering the Terra ecosystem is seemingly stuck in consolidation. According to some fundamental indicators, investors are weary and taking a hands-off approach.
LUNA price remains unresponsive as investors withdraw
Crypto prices often respond to market sentiment and since the LUNA crash happened, discussions surrounding the token have dropped significantly online. The Social Volume metric by Santiment shows the magnitude of the decline in LUNA mentions. With little to no action across all social channels, a breakout is unlikely to occur.
 [17.00.37, 11 Aug, 2022]-637958310994655005.png)
Terra Social Volume
LUNA price will likely stay in consolidation unless something drastic happens in its ecosystem or the larger cryptocurrency market. On August 9, the CEX.IO exchange added support for the LUNA token, but the price fluctuated only marginally to $2.08. It is possible the listing only ignited a minor price change because investors are less concerned about LUNA or because CEX.IO is not a big enough exchange to have an impact.
What's next for LUNA price
LUNA price is firmly holding support from the 100-day Simple Moving Average (SMA) on the four-hour chart. Capping movement on the upside is the Bollinger bands' middle throughline in conjunction with the 50-day SMA.
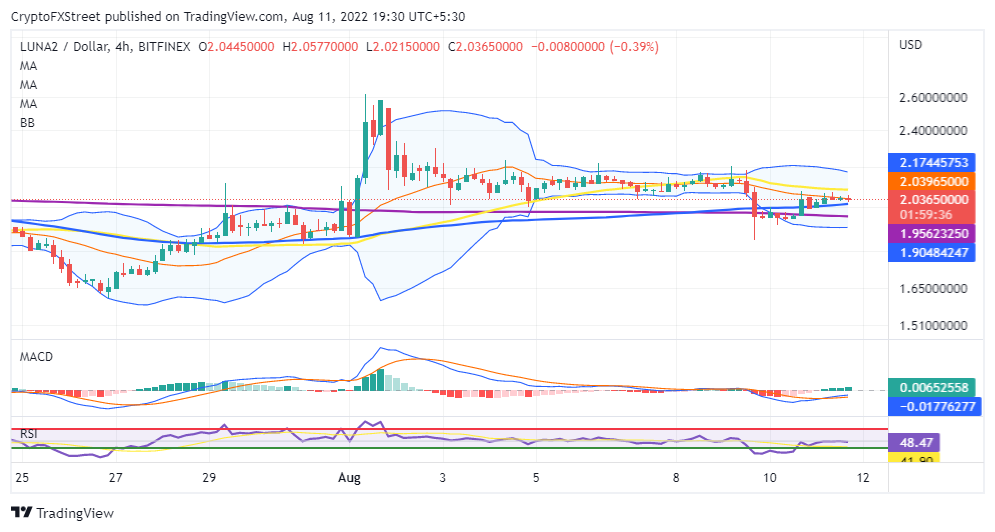
LUNA/USD four-hour chart
If the Relative Strength Index (RSI) continues to diverge from the price, there is a good chance LUNA will close the day below the inflection point at $2.00. Traders can make the most of the prospective bearish reversal while targeting support at the 200-day SMA.
LUNA price might ignore the above bearish sentiment if traders capitalized on a buy signal from the Moving Average Convergence Divergence (MACD). As the MACD closes the gap to the mean line and moves into the positive region, more buyers will stream into the market. The Bollinger bands upper boundary at $2.17 marks the LUNA price medium-term target, with bullish investors holding on till $2.60.
Author

John Isige
FXStreet
John Isige is a seasoned cryptocurrency journalist and markets analyst committed to delivering high-quality, actionable insights tailored to traders, investors, and crypto enthusiasts. He enjoys deep dives into emerging Web3 tren



