Why Shiba Inu price reached a market bottom
- Shiba Inu price is stabilizing near a major support level.
- Time cycles may warn that a new uptrend may begin soon.
- Downside risks are minimal compared to potential gains.

Shiba Inu price action has certainly faced its fair share of struggles. Despite the boring price action and bleak outlook, SHIBA is neither outperforming nor underperforming its peers.
Shiba Inu price setup for a massive rally, but conviction by bulls is necessary to begin that process
Shiba Inu price is down nearly 78% from its all-time high. It is currently trading in the same tight range that it experienced in late January 2022 to February 2022. The extended 2021 to 2022 Volume Profile shows that the $0.000020 to $0.000024 value area is the single largest participation zone for SHIBA.
Gann analysis and Ichimoku Analysis show a high probability that a new and extended expansion move is imminent from a time cycle perspective. For example, Shiba Inu price is now on day 190 from its all-time high. This is important because in Gann analysis, the 180 -day Gann Cycle of the Inner Year (180 days to 198 days) is the second most powerful in the 360-day Inner Year Cycle. Gann wrote that if an instrument has been trending over 180 days, then a reversal in the trend is likely to occur.
From an Ichimoku perspective, the time cycle currently present is the Kumo Twist. Kumo Twists are events when Senkou Span A crosses above or below Senkou Span B. This is represented visually by the Ichimoku Cloud changing colors from red to green or green to red. The date of the Kumo Twist can often warn traders that a new swing low or swing high is likely to develop on or around that date.
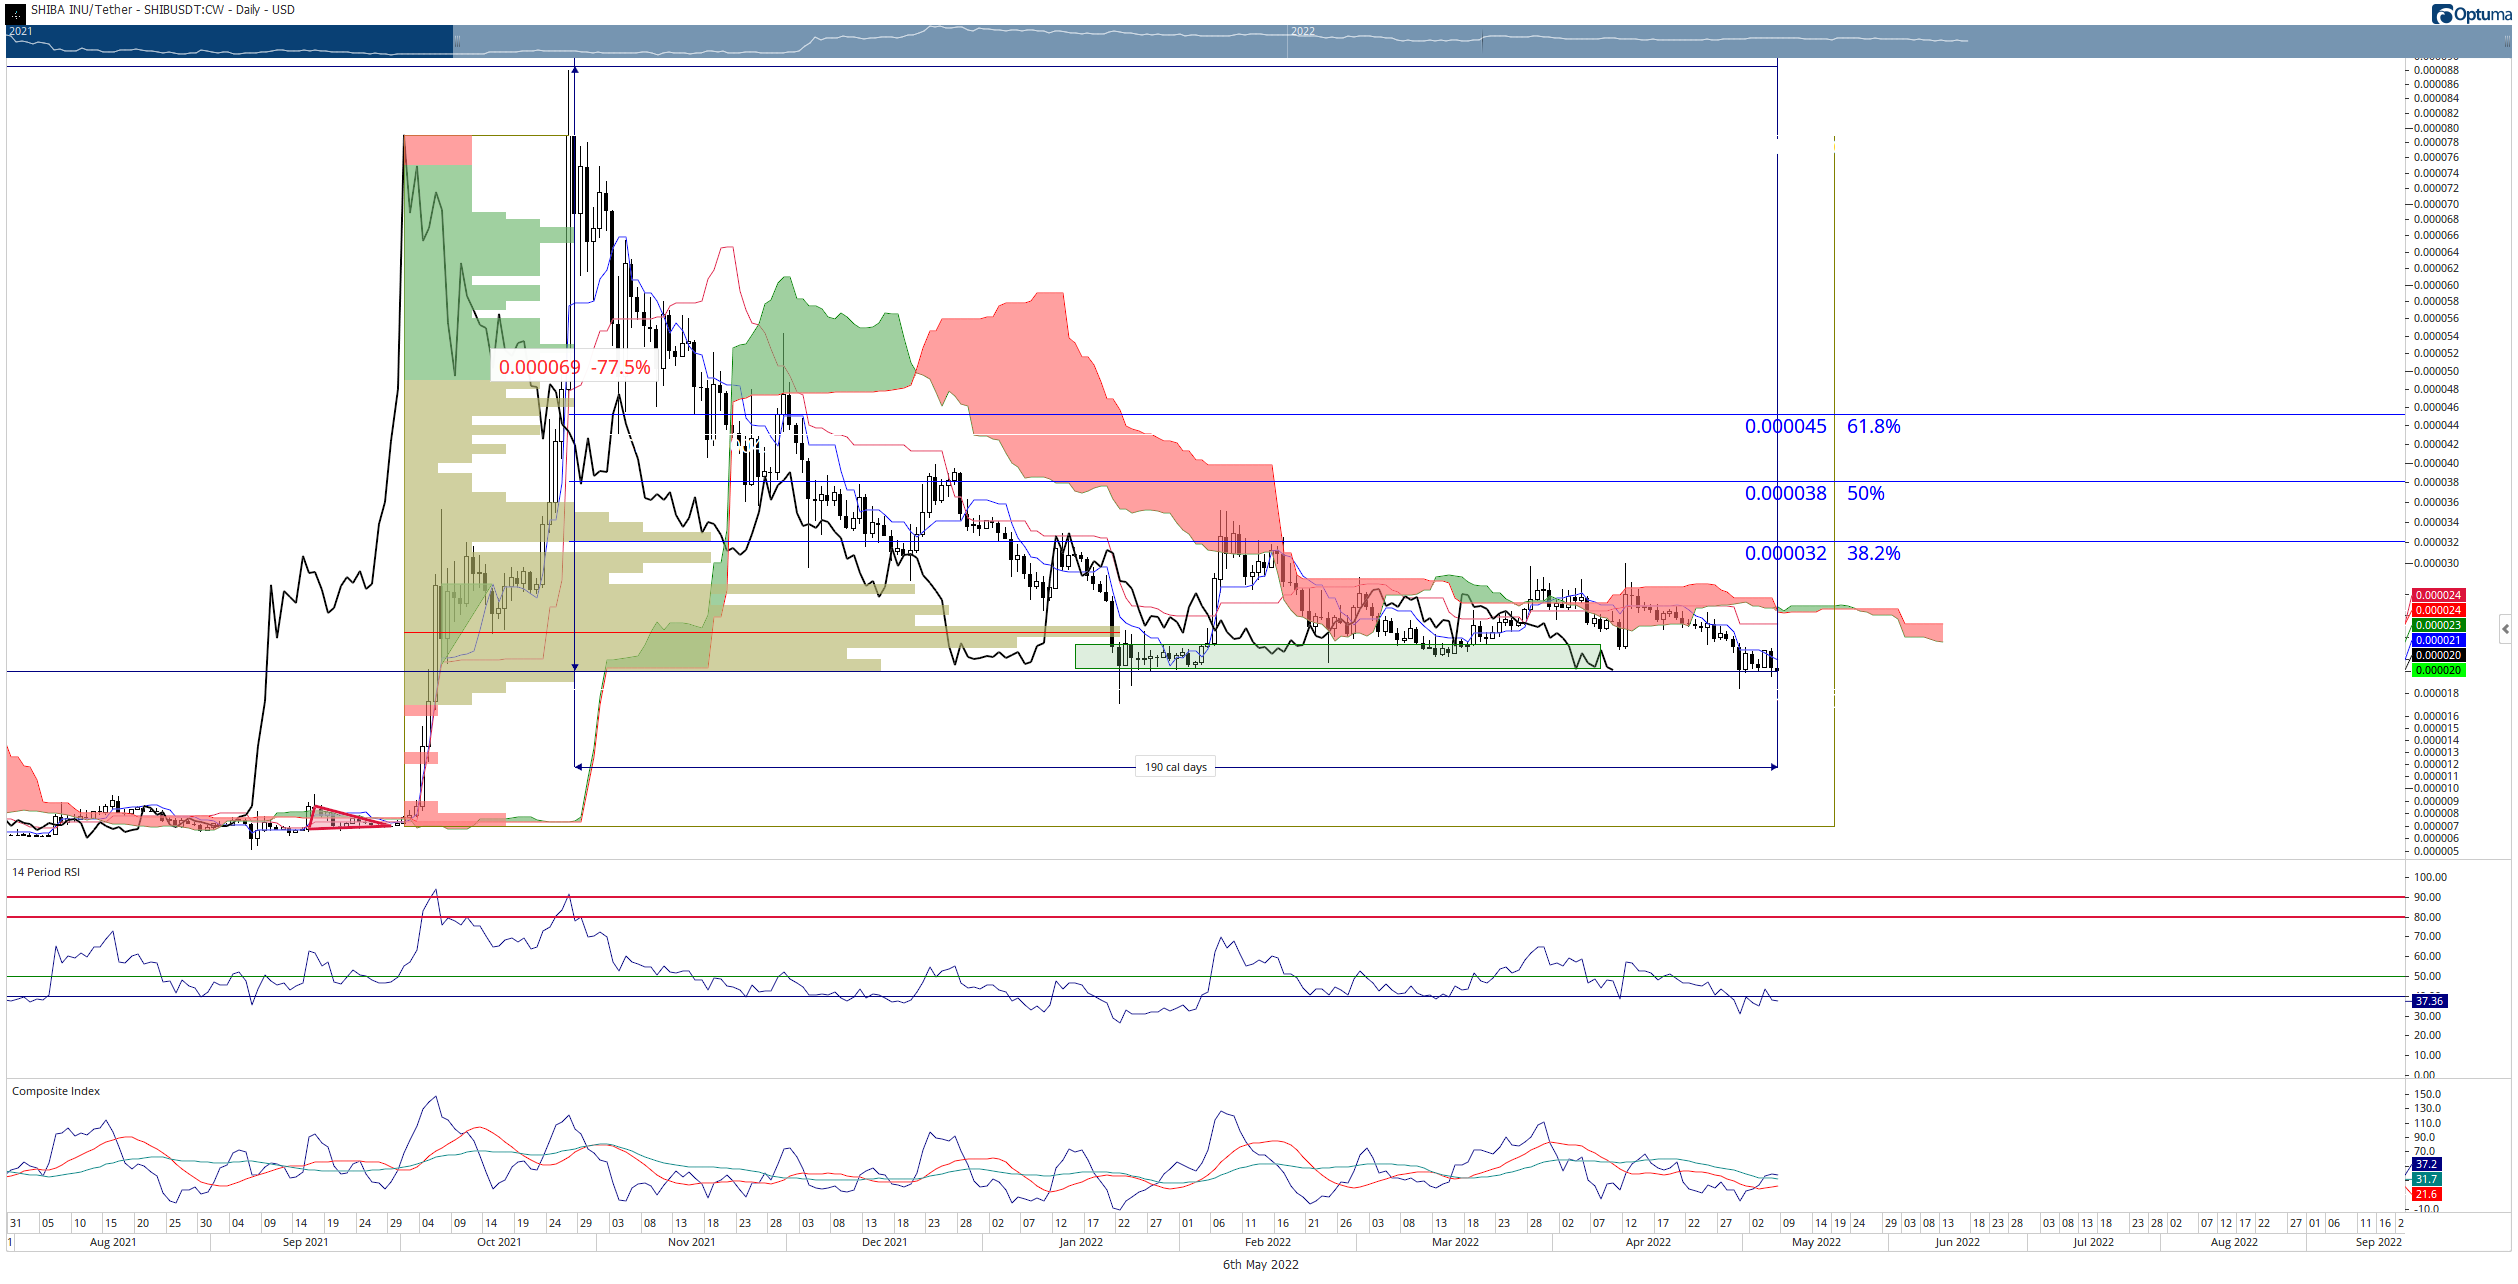
SHIBA/USDT Daily Ichimoku Kinko Hyo Chart
The key breakout range for Shiba Inu price bulls is a daily close at or above $0.000026. In that scenario, SHIBA would complete an Ideal Bullish Ichimoku Breakout, positioning it for the next major bullish leg higher. The projected range that SHIBA would test as resistance is the 61.8% Fibonacci retracement at $0.00045.
Downside pressure, however, remains a major concern. The current price action, despite the time cycles, is overwhelmingly bearish. Therefore, if Shiba Inu price experiences several daily closes below the $0.000019 value area, it will likely trigger a massive flash crash due to the non-existent volume in the Volume Profile.
Author

Jonathan Morgan
Independent Analyst
Jonathan has been working as an Independent future, forex, and cryptocurrency trader and analyst for 8 years. He also has been writing for the past 5 years.




