This MATIC price prediction is so far the best trade of 2022
- MATIC price rallied 125% since July 1; FXStreet analysts were able to find an entry capturing 68% of the rally for an 85% increase in profit.
- Polygon price has extended targets in the $1.25 region, but a possible retracement into $0.64 remains on the table.
- Invalidation of the uptrend scenario remains a breach below $0.54 until further notice.

MATIC price recent upswing is one of the best forecasted trade setups made this year. Here’s a full recap of what just took place.
The potential bullrun was spotted on June 27th
"The shallow pullback provides bears a fair chance to close their orders and join the bulls. If the technicals are genuine, a second breach through $0.61 could trigger a bullish spike towards $1 in the coming days. Ultimately, denial could be the catalyst to provoke an additional rally."
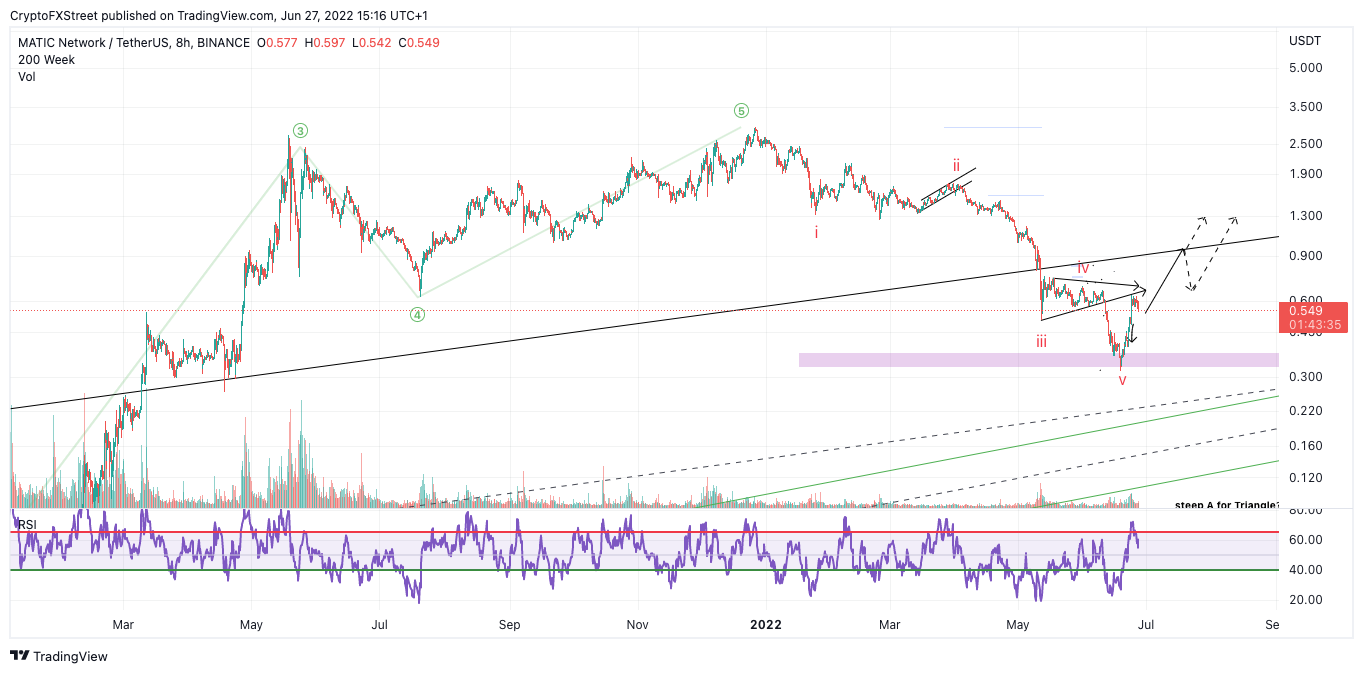
MATIC/USDT 4-Hour Chart 6/27/22 Original Bullish Thesis
The call was made on July 6th
“If market conditions are genuinely bullish, an additional retest of the trend line will not be necessary. A second attempt from the bulls to breach the $0.540 level should be the catalyst to induce a bull rally targeting $1.00.”
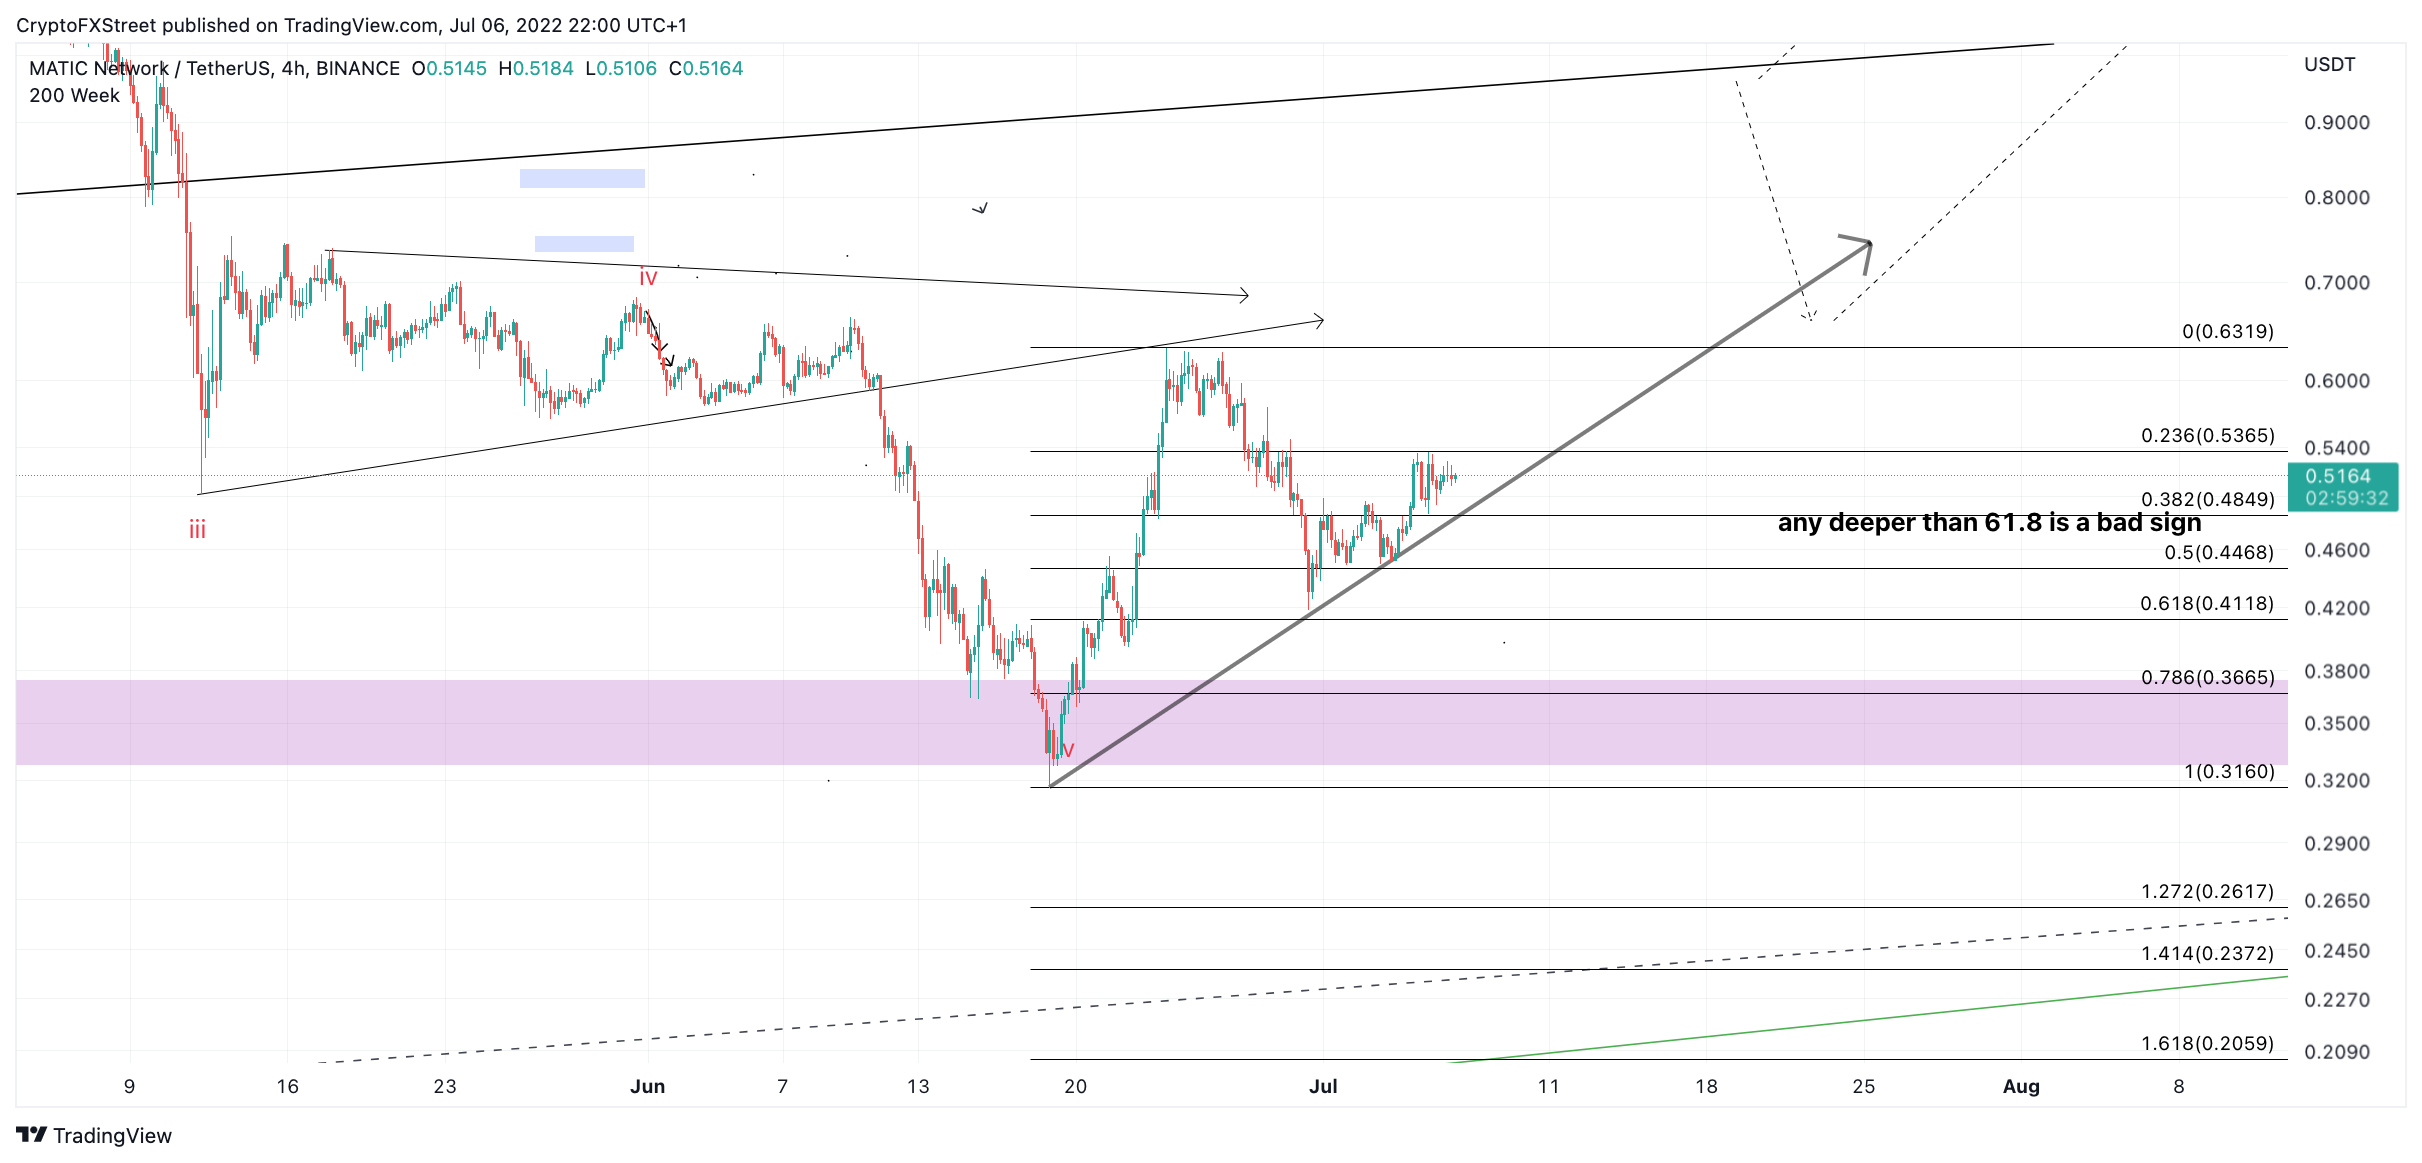
MATIC/USDT 4-Hour Chart. 7/06/22 Bullish Setup Thesis
Highlighted in bold, the risk was stated:
“Being an early bull is justifiable as the invalidation level is clear. Invalidation of the bullish trend is now a breach below the ascending trend line at $0.48.”
One week later the MATIC price rallied 30% and traders enjoyed a profit of 4x their risk.
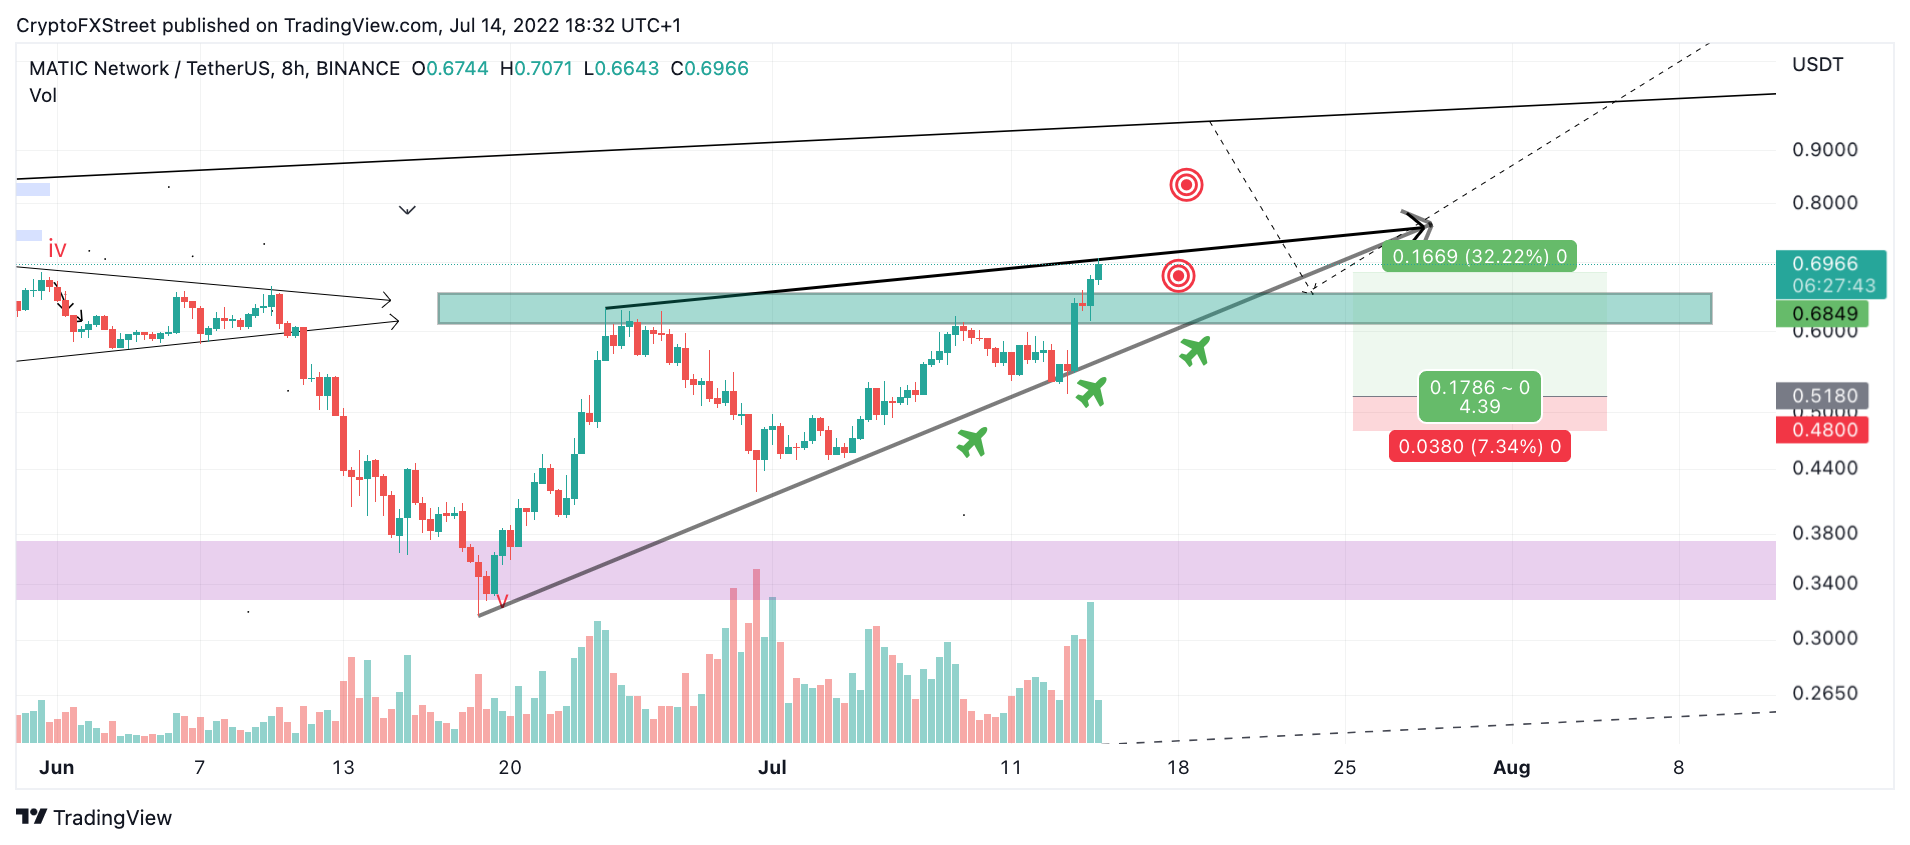
Matic/USDT 8-Hour Chart June 14 Bullish Setup Follow Up Thesis
A follow up thesis was issued, emphasizing pulling risk off the table
"Invalidation of the uptrend targeting $1.00 can be moved into profit from $0.48 to $0.54."
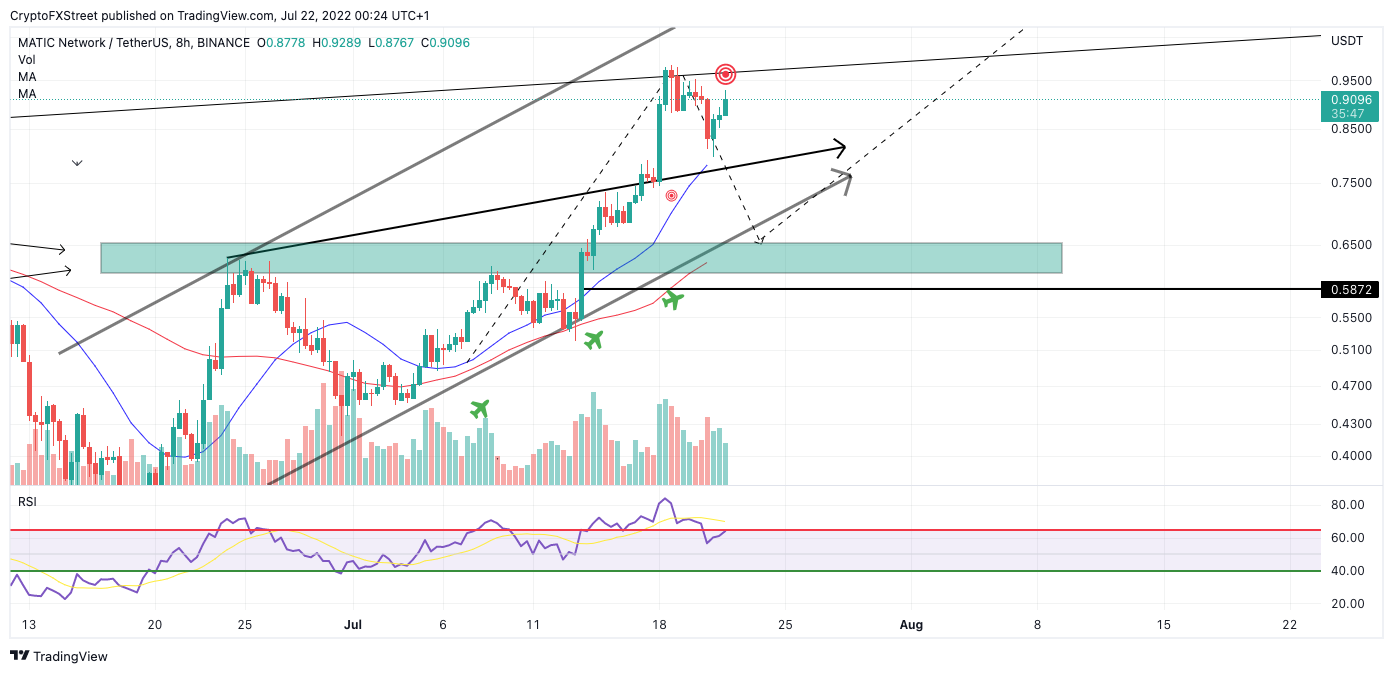
Within three days time, MATIC price ascended into the upper trend target to reach a high at $0.9849, a penny short of the prophesied one dollar target.
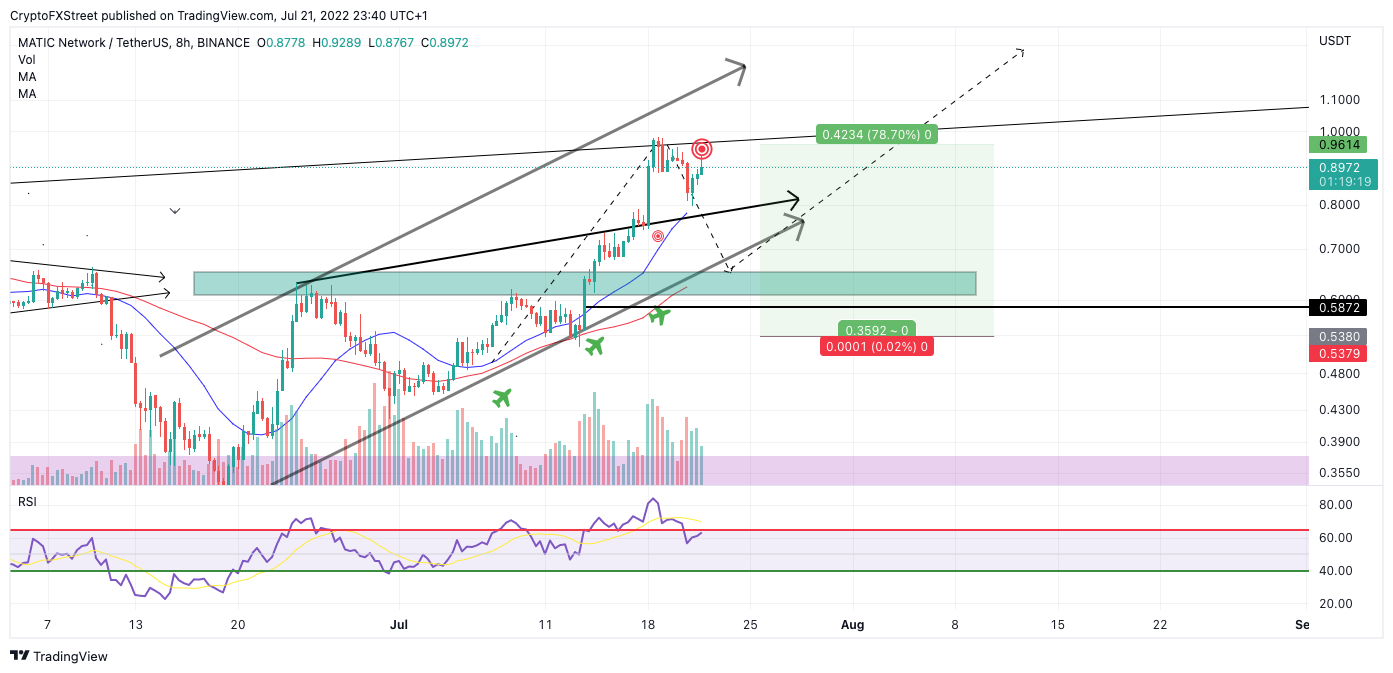
MATIC/USDT 8-Hour Chart. 7/21/22
Subscribers who partook in the original move witnessed an 85% increase in price. For every one dollar risked, $13 dollars of profit was made.
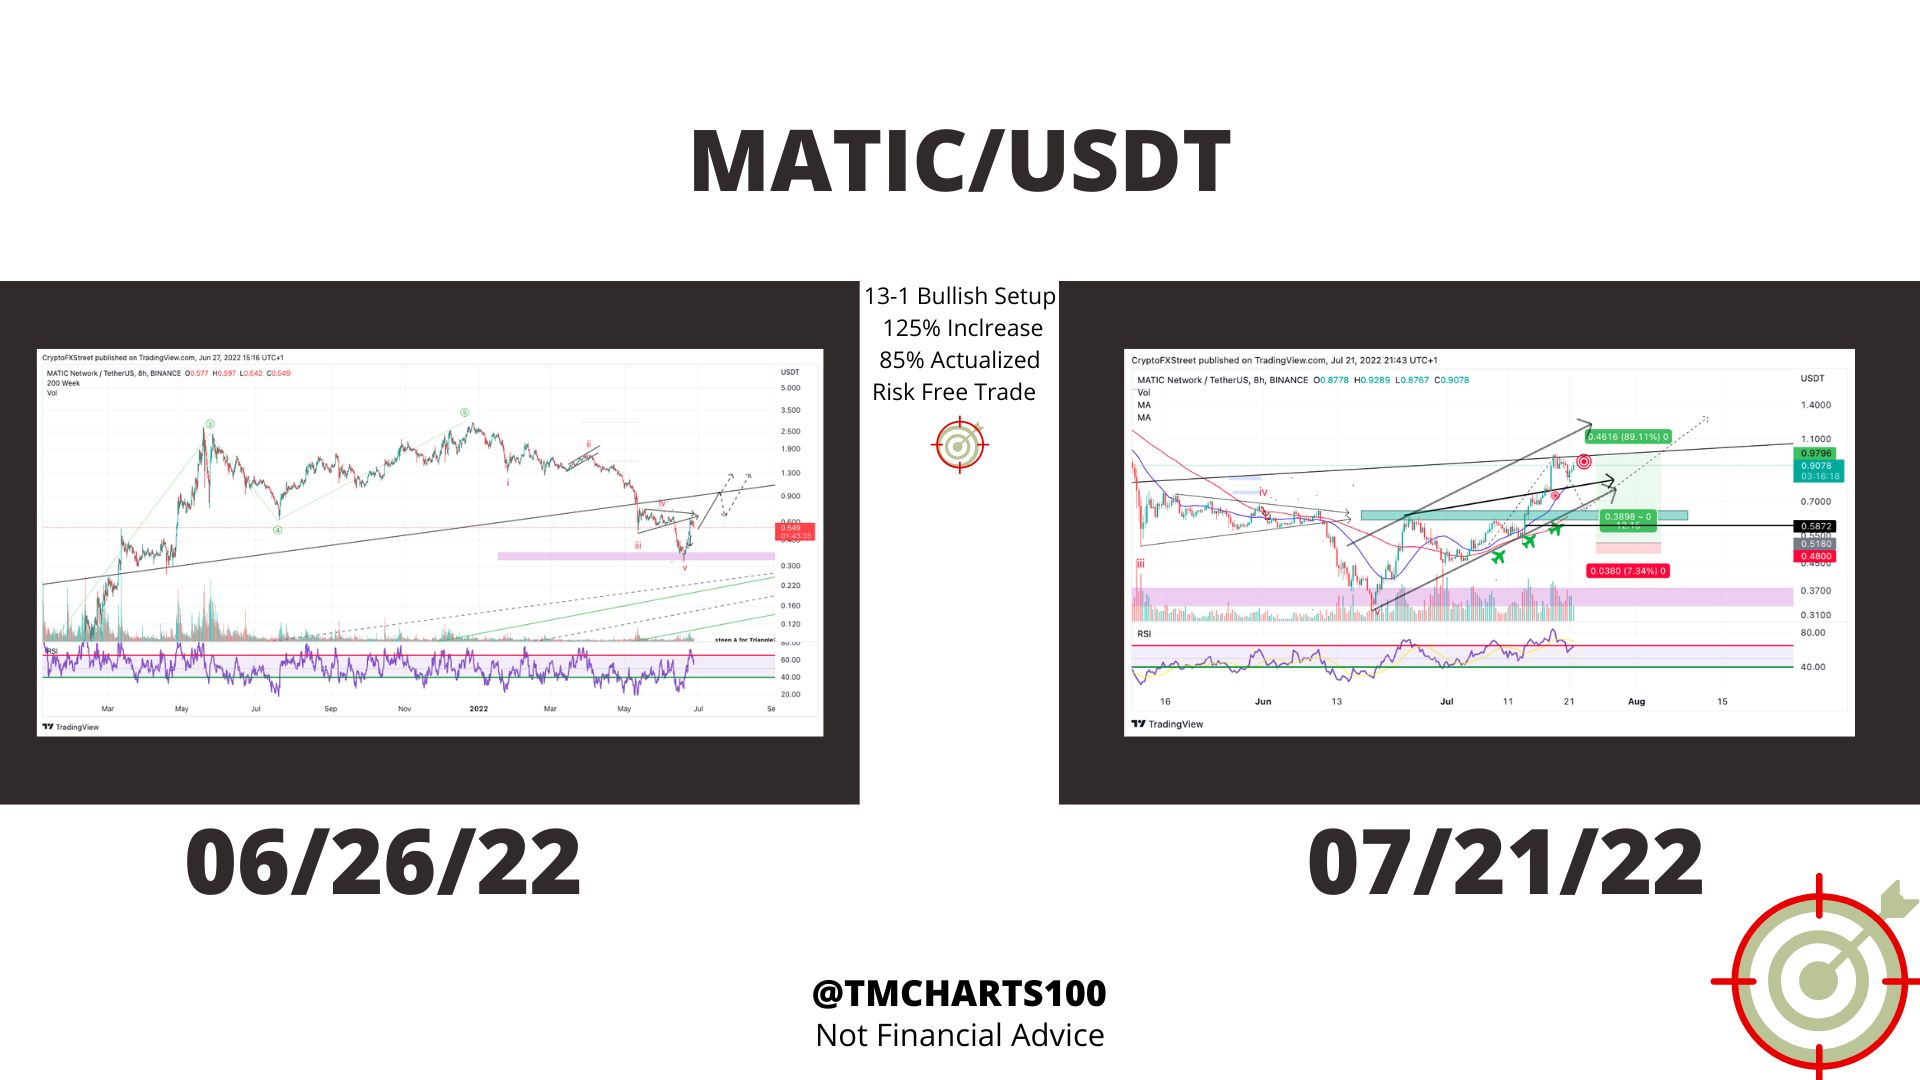
MATIC/USDT 7/21/22 Full Recap
The bulls who joined later on June 14 saw a 60% increase in price before significant bearish signals entered the market at the upper $0.95 region on July 17. For every one dollar risked, nearly $8 dollars of profit was actualized. Overall this 13-1 reward-to-risk setup has been one of the best forecasts this Crypto Season.
MATIC/USDT 8-Hour Chart. 7/21/22
MATIC price has extended targets in the $1.25 zone.
New technichals suggest a break above $1.02 could be the catalyst to induce an additoional 40% rally. For this reason Traders shouild keep close eye on the Polygon in the coming dsys. Invalidation of the uptrend is still at $0.54
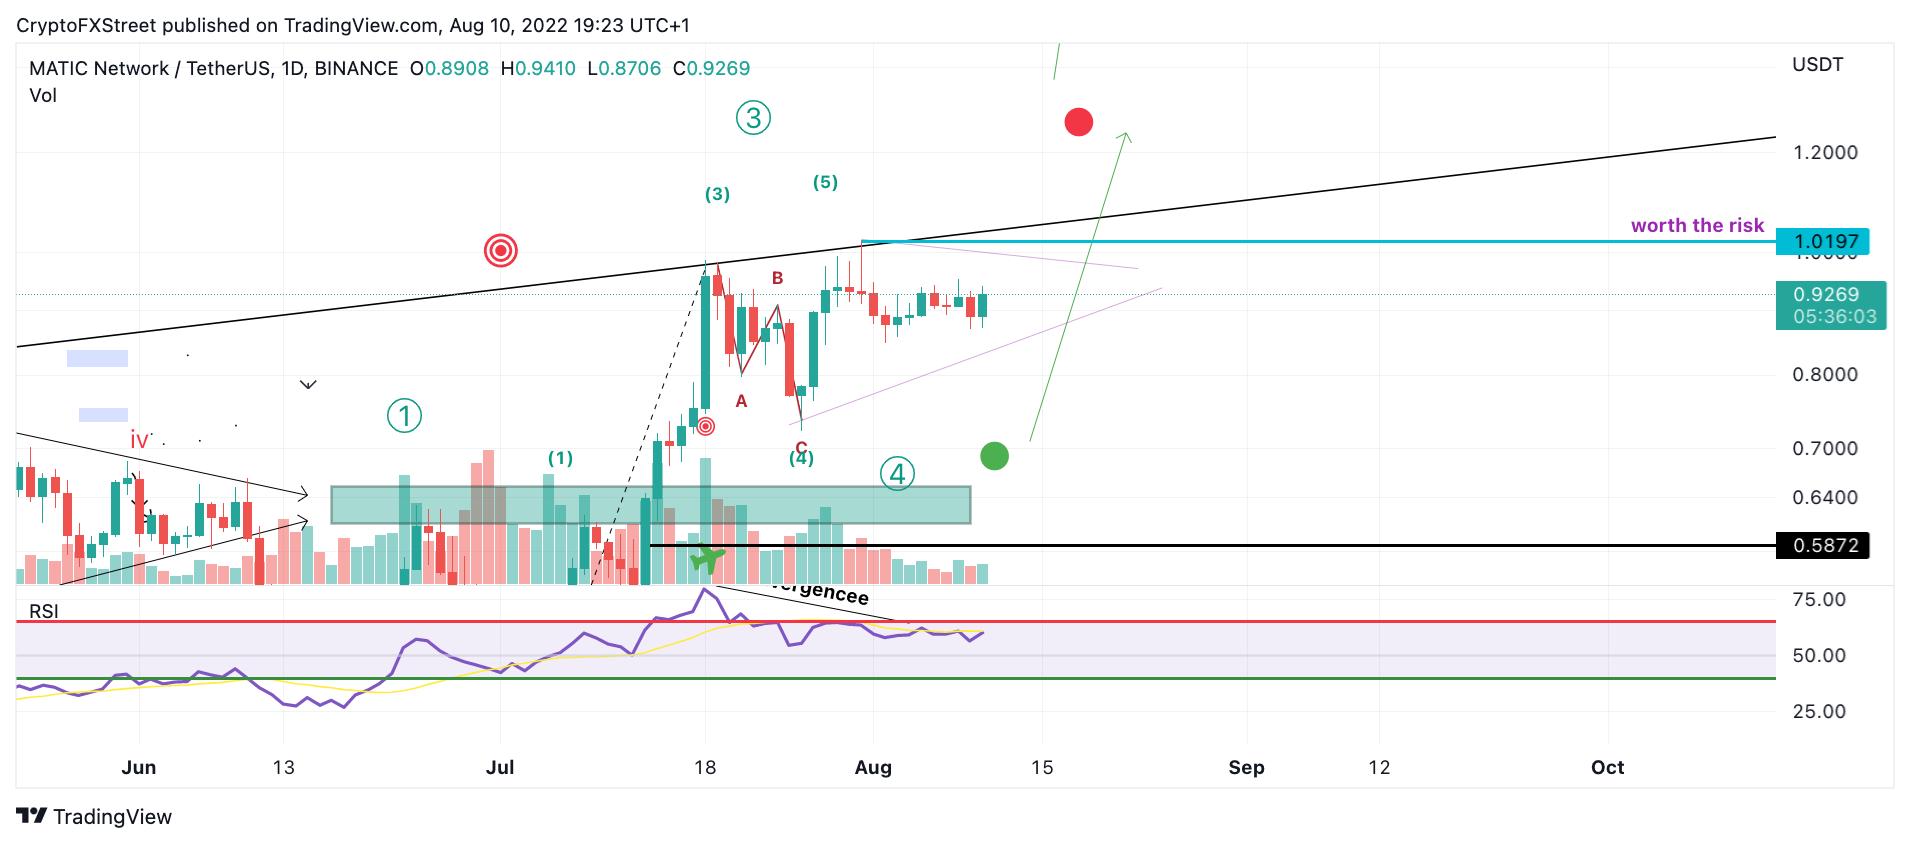
MATIC/USDT 1-Day Chart
In the following video, FXStreet analysts deep dive into the technicals and fundamentals of top Altcoins, analyzing key levels in the market
Author

Tony M.
FXStreet Contributor
Tony Montpeirous began investing in cryptocurrencies in 2017. His trading style incorporates Elliot Wave, Auction Market Theory, Fibonacci and price action as the cornerstone of his technical analysis.


