Why Polygon's MATIC is not yet set to switch to an uptrend
- Polygon's price is set to close the week out with a loss but refrains from returning to lower levels.
- MATIC price sees a fade unfolding as bulls take short-term profit.
- With the summer starting, expect lower volumes and bigger price jumps.

Polygon (MATIC) traders must welcome the summer like this year; it is probably the best and only window that they will have to make some profit. And even that prospect looks quite dire as bulls shot themselves in the foot by trying to annex the backbone of the downtrend that that s been hovering on top of the price action since April. Expect an overall downtrend but less consecutive, as seen in the first part of 2022.
MATIC sending mixed signals
Polygon price action saw bulls attempting to plant a flag above the one element that currently accounts for the backbone of the downtrend for most of 2022. The 55-day Simple Moving Average (SMA) has been present as a cap since it delivered a rejection to MATIC in mid-April. With another rejection this week, MATIC looks set to tank another few weeks throughout the summer, although the thinner liquidity could also bring a rare bullish candle from time to time.
MATIC price set to dip lower after bulls started to take profit once hitting that 55-day SMA at $0.60. Expect a further slide nearing $0.390, which will be critical to see where MATIC price will close this night and open the new week on Monday in the ASIA PAC. As long as the low from last week is not broken to the downside, a bullish candle could still be in the cards for next week, but the overall tone remains bearish.
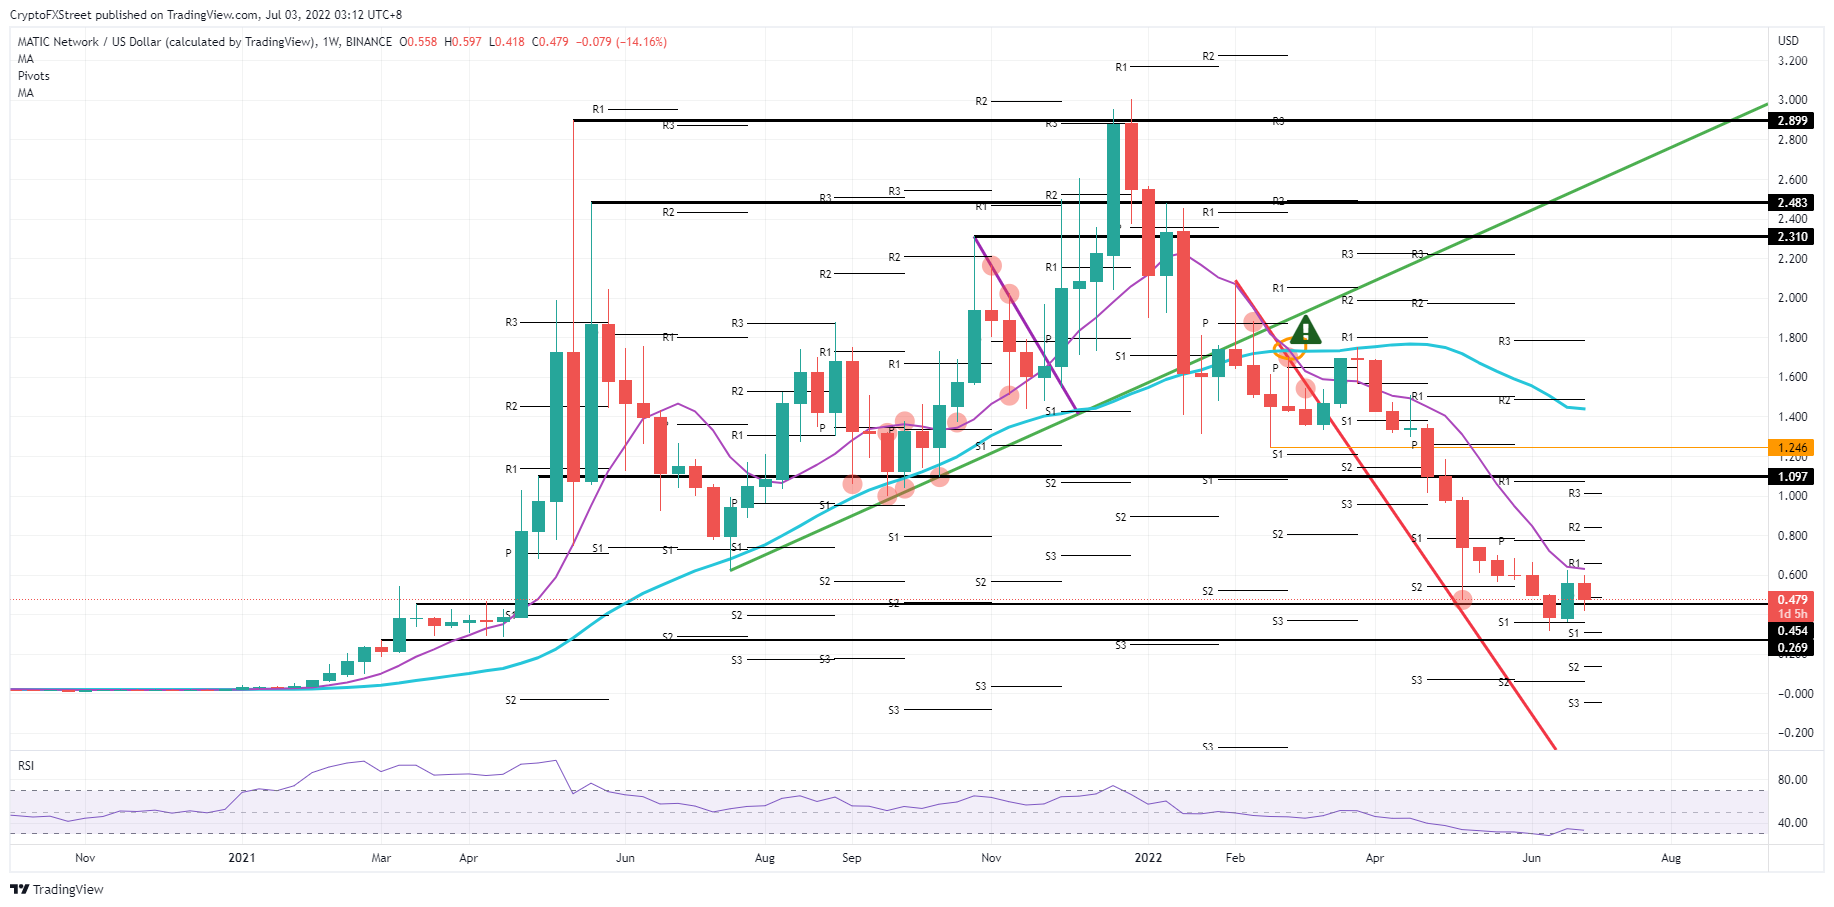
MATIC/USD weekly chart
By the start of next week, it could turn out that this week's price action was a mere fade under profit-taking near that 55-day SMA. Should in the coming week equity markets rally, rates drop a little, and a more risk-on tone hovers around markets, a second attempt and possible squeeze against the 55-day SMA could be happening. That way, momentum builds for a bullish breakout and a rally that could run into $1.10 to the upside.
Author

Filip Lagaart
FXStreet
Filip Lagaart is a former sales/trader with over 15 years of financial markets expertise under its belt.



