- Polygon price action sees pressure coming from both sides.
- MATIC price could see its trend over the weekend defined by a close either above or below a pivotal level.
- Expect to see a medium-term breakout as price action starts trading in a narrow way.
Polygon (MATIC) price is seeing both bulls and bears approaching each other as price action makes lower higher and higher lows since mid-June. As a new month starts, the new monthly pivot level gets repriced almost right in the middle of today’s price action in the ASIA PAC and European session. It will be key to see near the closing bell this evening if MATIC closes above or below the pivotal level to determine which initial trend to be formed in July.
MATIC price caught between a rock and a hard place
Polygon price is trending in a squeeze from both sides as price action consolidates with bears and bulls nearing each other. That fact is also represented in the Relative Strength Index (RSI), which has been trading above 50, after coming out of oversold. Thus far, all looks good in this price equilibrium, although the start of a new month reprices the crucial monthly pivot levels and sets the mid-pivot almost in the centre of today’s price action, making it a crucial element to determine where price action will close this evening.
MATIC price is expected to close below the monthly pivot for July as the current market narrative is still quite bearish, and equity markets have started another leg lower these past few days. Expect a break below $0.450 and a slide towards $0.300 with the new monthly S1 support positioned before $0.269 to catch any price falls beforehand. This means roughly a 35% negative result and a possible new low for this year.
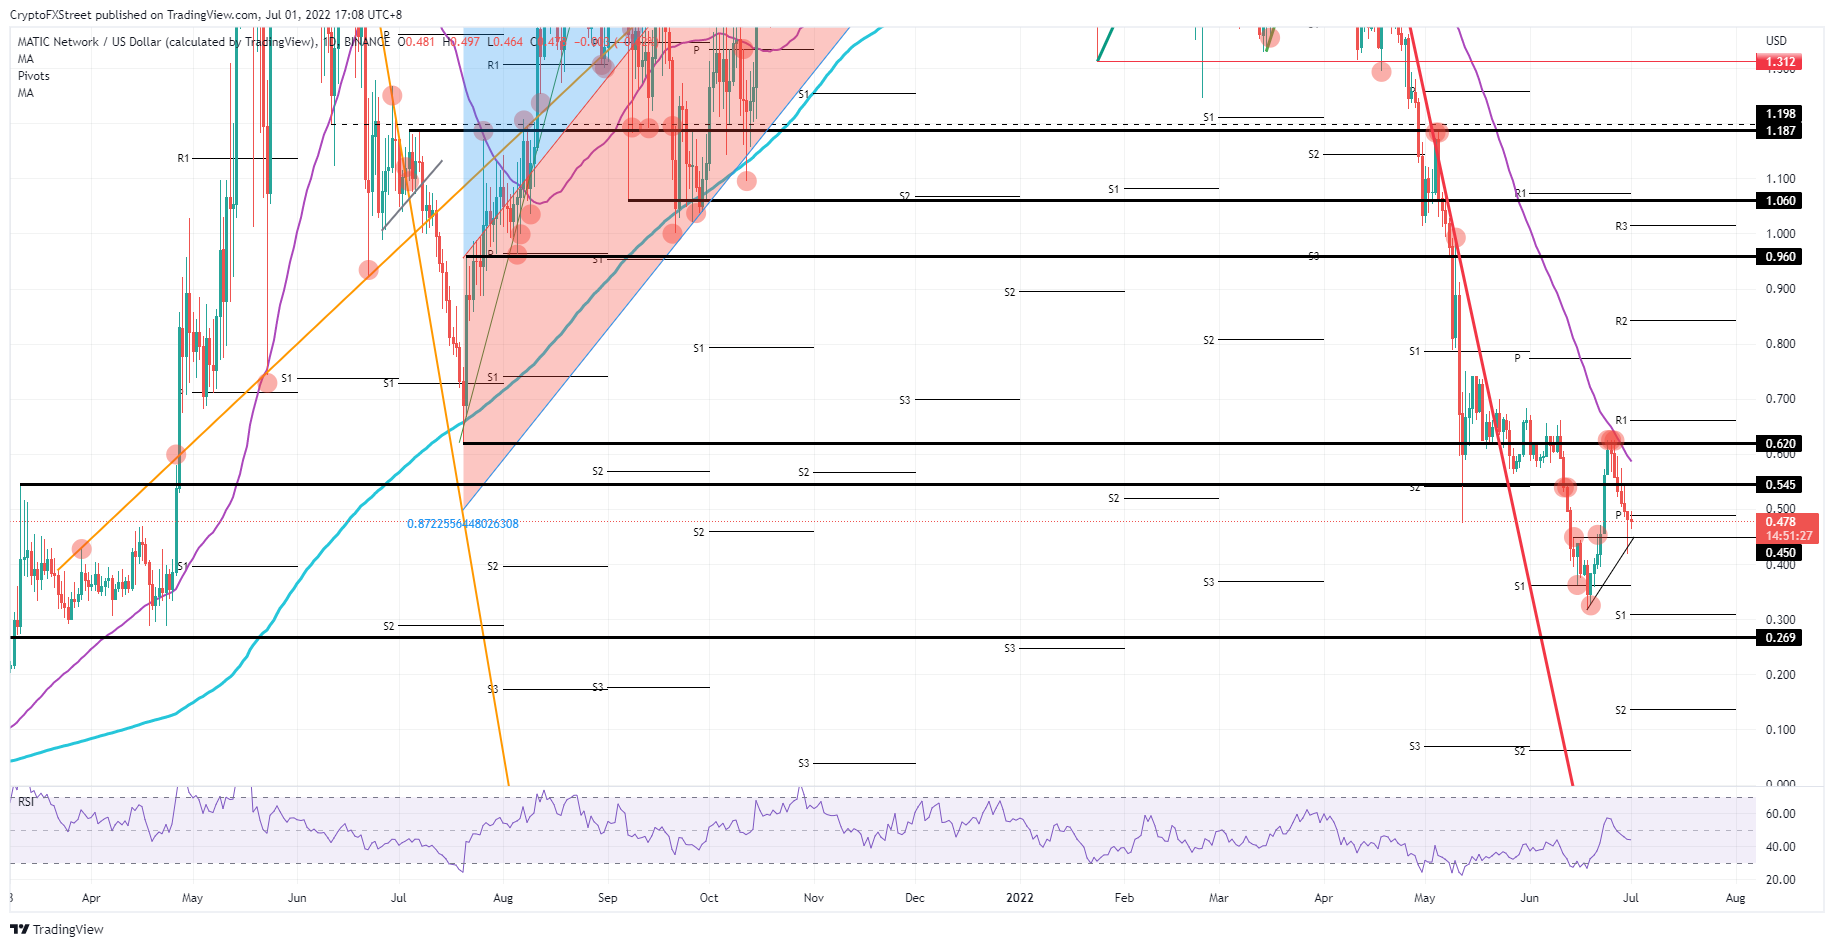
MATIC/USD daily chart
As mentioned above, the daily close for today could be above the fresh monthly pivot, and in that case, it will mean that going into the weekend, a rally could unfold towards $0.545 as volume dies down a little bit and moves could get stretched quicker as fewer market participants will be present. Even a $0.620 would not be impossible, although the 55-day Simple Moving Average could be proven again to be the one hurdle to break the rally, as it has in the past.
Information on these pages contains forward-looking statements that involve risks and uncertainties. Markets and instruments profiled on this page are for informational purposes only and should not in any way come across as a recommendation to buy or sell in these assets. You should do your own thorough research before making any investment decisions. FXStreet does not in any way guarantee that this information is free from mistakes, errors, or material misstatements. It also does not guarantee that this information is of a timely nature. Investing in Open Markets involves a great deal of risk, including the loss of all or a portion of your investment, as well as emotional distress. All risks, losses and costs associated with investing, including total loss of principal, are your responsibility. The views and opinions expressed in this article are those of the authors and do not necessarily reflect the official policy or position of FXStreet nor its advertisers. The author will not be held responsible for information that is found at the end of links posted on this page.
If not otherwise explicitly mentioned in the body of the article, at the time of writing, the author has no position in any stock mentioned in this article and no business relationship with any company mentioned. The author has not received compensation for writing this article, other than from FXStreet.
FXStreet and the author do not provide personalized recommendations. The author makes no representations as to the accuracy, completeness, or suitability of this information. FXStreet and the author will not be liable for any errors, omissions or any losses, injuries or damages arising from this information and its display or use. Errors and omissions excepted.
The author and FXStreet are not registered investment advisors and nothing in this article is intended to be investment advice.
Recommended Content
Editors’ Picks

Shiba Inu eyes positive returns in April as SHIB price inches towards $0.000015
Shiba Inu's on-chain metrics reveal robust adoption, as addresses with balances surge to 1.4 million. Shiba Inu's returns stand at a solid 14.4% so far in April, poised to snap a three-month bearish trend from earlier this year.

AI tokens TAO, FET, AI16Z surge despite NVIDIA excluding crypto-related projects from its Inception program
AI tokens, including Bittensor and Artificial Superintelligence Alliance, climbed this week, with ai16z still extending gains at the time of writing on Friday. The uptick in prices of AI tokens reflects a broader bullish sentiment across the cryptocurrency market.

Bitcoin Weekly Forecast: BTC consolidates after posting over 10% weekly surge
Bitcoin price is consolidating around $94,000 at the time of writing on Friday, holding onto the recent 10% increase seen earlier this week. This week’s rally was supported by strong institutional demand, as US spot ETFs recorded a total inflow of $2.68 billion until Thursday.

XRP price could renew 25% breakout bid on surging institutional and retail adoption
Ripple price consolidates, trading at $2.18 at the time of writing on Friday, following mid-week gains to $2.30. The rejection from this weekly high led to the price of XRP dropping to the previous day’s low at $2.11, followed by a minor reversal.

Bitcoin Weekly Forecast: BTC consolidates after posting over 10% weekly surge
Bitcoin (BTC) price is consolidating around $94,000 at the time of writing on Friday, holding onto the recent 10% increase seen earlier this week.

The Best brokers to trade EUR/USD
SPONSORED Discover the top brokers for trading EUR/USD in 2025. Our list features brokers with competitive spreads, fast execution, and powerful platforms. Whether you're a beginner or an expert, find the right partner to navigate the dynamic Forex market.