Why Investors may want to prepare for a discounted MATIC price
- MATIC price fails to break through the upper boundary of the trend channel twice.
- The rejection occurred at a crucial bearish level on the Relative Strength Index after climbing back from oversold territory.
- Invalidation of the bearish thesis is a breach above $0.86

Polygon’s MATIC price hints at a strong bearish influence. The signals may be uncommon to the untrained eye.
MATIC price might become problematic
MATIC price is down 7% on the month as the bears have jumped back into the market during the second week of October. The down move was catalyzed near the top of a descending parallel channel that also acted as strong resistance in September when the smart contract token auctioned near $0.90. The consecutive rejections near the descending barrier could be the early imprint of a much stronger influence on the MATIC price than meets the eye.
MATIC price currently auctions at $0.79 as the bulls have lost ground from the 8-day exponential moving average. The Polygon Network token is now testing the 21-day simple moving average as the next level of support. If the indicator does not hold, the downtrend move targeting the lower end of the descending channel near $0.62 will likely be solidified.
The Relative Strength Index confounds a strong beamish presence as The recent rejection from near the upper bounds of the descending trend channel occurred simultaneously at a key bearish. It is worth noting that the bulls climbed into the resistance barrier after falling into extremely oversold territory on higher time frames.
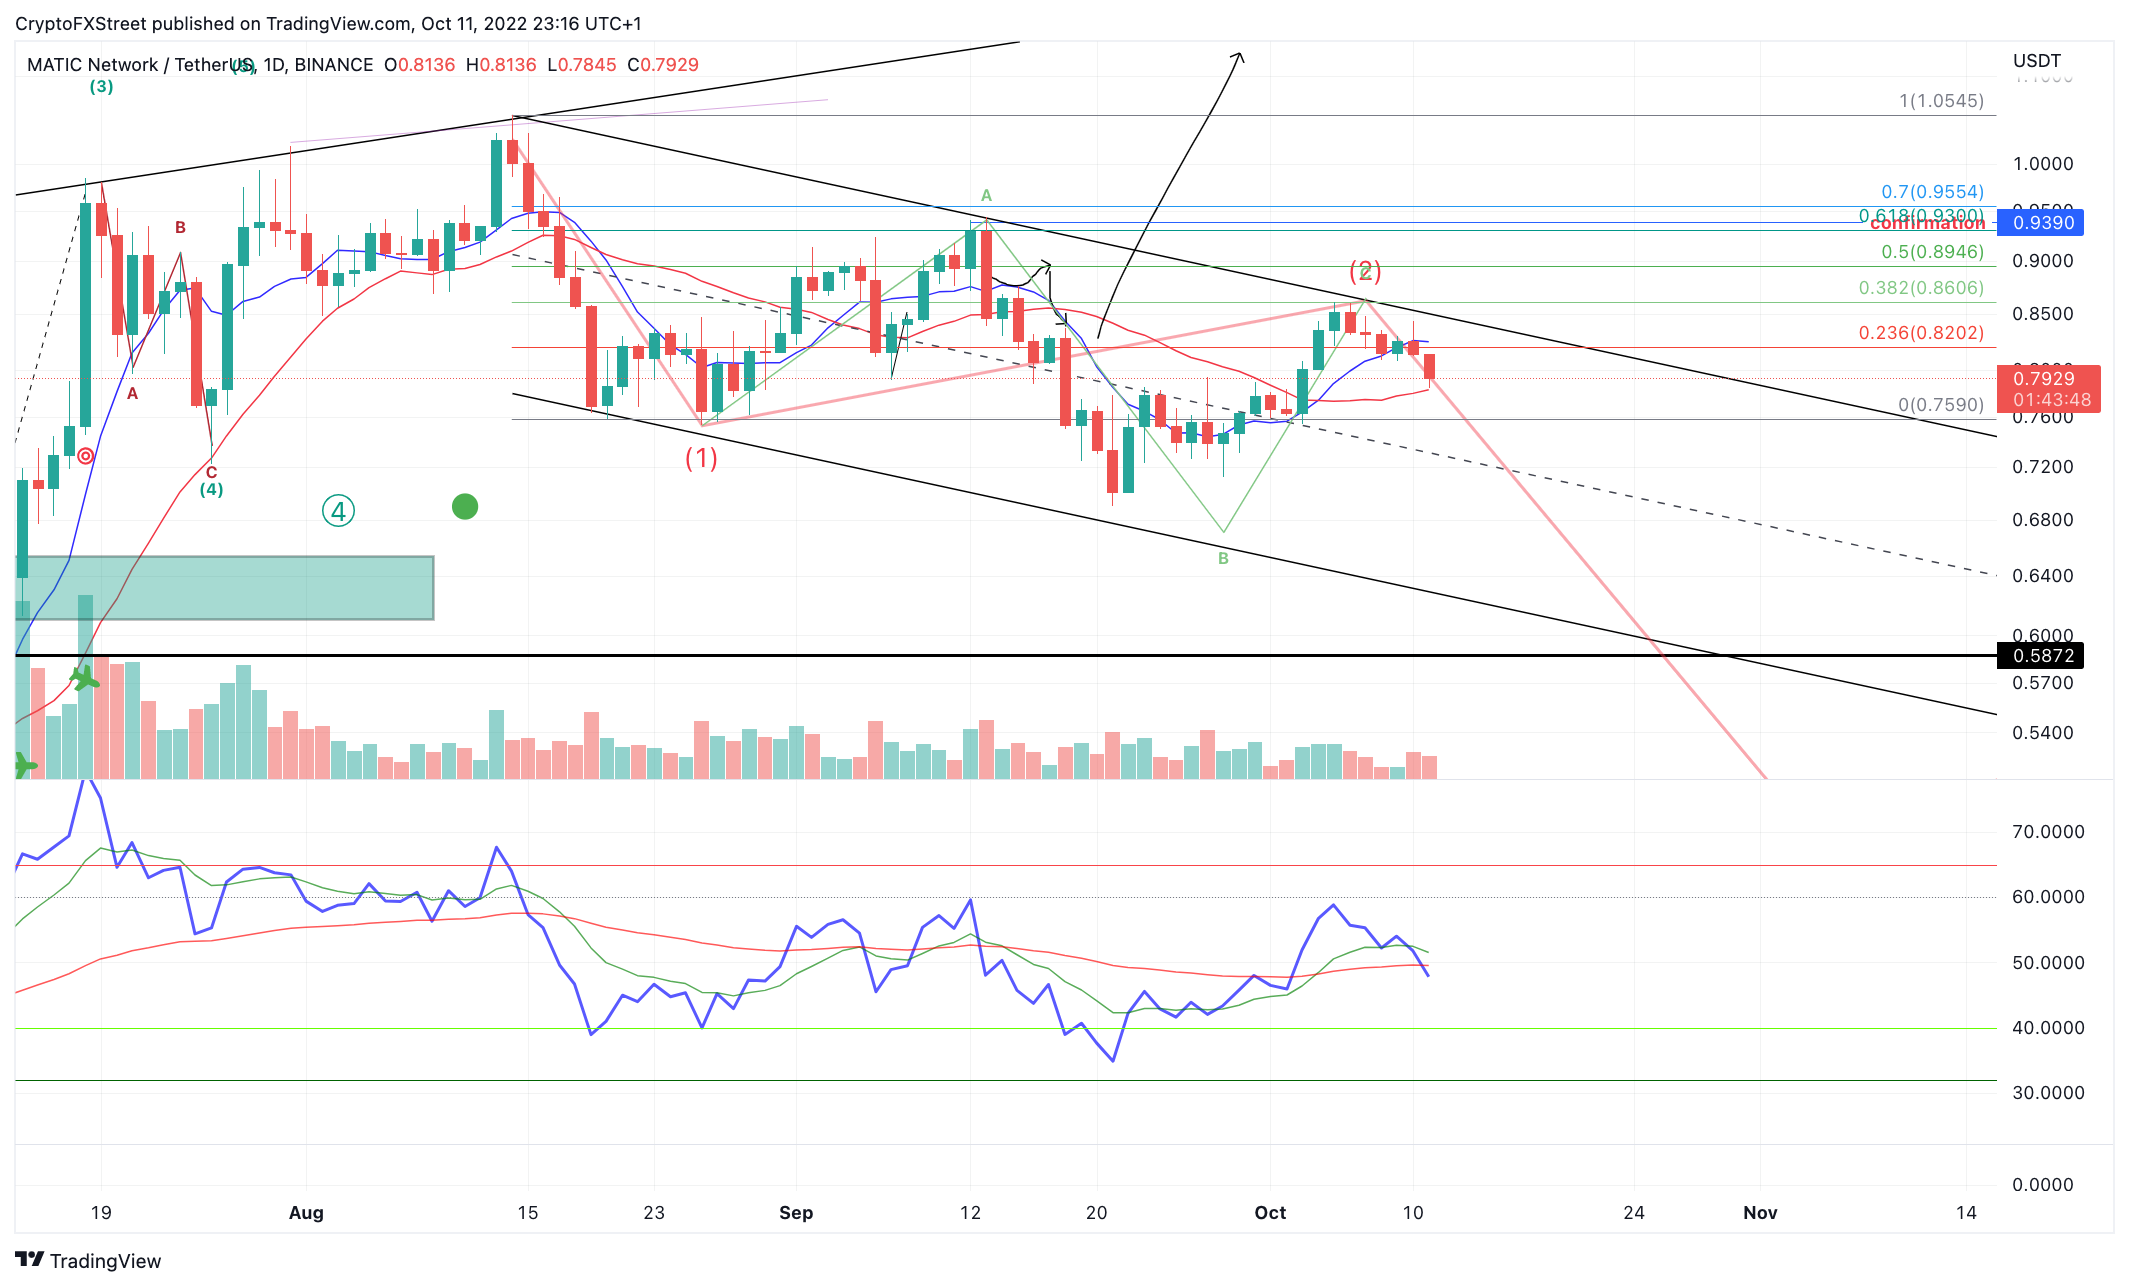
MATIC/USDT 1-Day Chart
The scenario underway for Polygon could be problematic when tying it all together. The RSI indicator may suggest that the same bears who descended price into oversold levels are now back in the market and will be aiming to establish new lows again.
Still, technical analysis is always subject to interpretation and is never a set guarantee. Invalidation of the bearish thesis is a breach above the recent swing high at $0.86. If the bulls can hurdle the barrier, an additional rally toward the $1.20 liquidity levels could occur. Such a move would result in a 50% incline crease from the current MATIC price.
In the following video, FXStreet analysts deep dive into the technicals and fundamentals of MATIC, analyzing key levels in the market
Author

Tony M.
FXStreet Contributor
Tony Montpeirous began investing in cryptocurrencies in 2017. His trading style incorporates Elliot Wave, Auction Market Theory, Fibonacci and price action as the cornerstone of his technical analysis.



