Why a 13.52% nosedive in Litecoin price is not a bad idea
- Litecoin price confirms a 13.52% symmetrical triangle breakout.
- LTC may collect more liquidity on its path to $46.64, ahead of a significant recovery to $100.
- Overhead pressure continues to build among investors who bought LTC at $52.60.

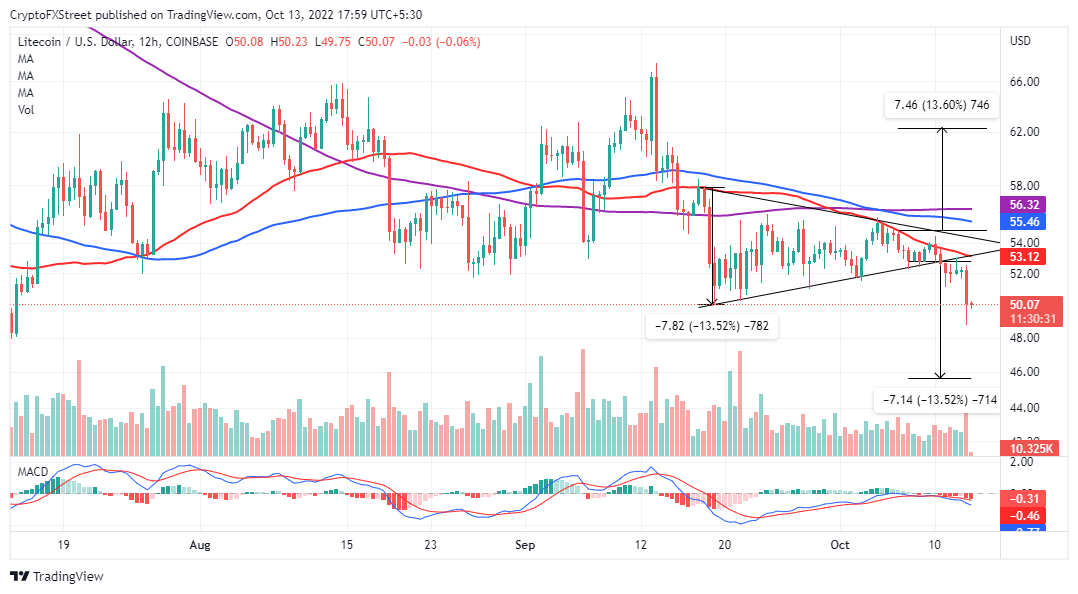
Litecoin price is exploring downhill levels beneath $50.00 after several weeks of mundane consolidation. As discussed last week, the coin could close the day around $46.64 if sellers capitalize on a symmetrical triangle breakout.
Litecoin price hunt for the bottom persists
Litecoin price settled above support at $50.00 in the middle of September in the wake of the prior rejection from $67.50. Bulls moved swiftly to regain the lost ground, but overhead pressure at $58.00 curtailed their progress. The tug of war between the bulls and bears continued for most of October’s first two weeks, representing itself on the chart as a symmetrical triangle pattern.
As covered in last week’s analysis, a breakout from the triangle pattern forecasted Litecoin price sliding to $46.64. A break below the triangle’s lower trend line confirmed the expected breakout on Monday, leaving LTC price vulnerable to bearish advances.
LTC/USD 12-hour chart
Litecoin price exchanges hands at $48.88 after a 7.02% drop from the triangle’s breakout point. The Litecoin price technical outlook hints at further declines to complete the 13.52% target generated from the triangle’s breakout point. A 12-hour to a daily close above $50.00, however, would invalidate potential losses to $46.64.
The MACD (Moving Average Convergence Divergence) indicator adds credence to the pessimistic narrative. A sell signal presented on Monday after the 12-day EMA (Exponential Moving Average) appeared to be calling more sellers into the market. As long as the MACD stays below the mean line (MACD) and on a downward slope, Litecoin price will have a tendency to decline to lower levels.
As per insights from IntoTheBlock’s IOMAP chart, an immediate recovery for Litecoin price remains a pipe dream. The approximately 400,500 addresses that purchased LTC coins around $52.60 might consider selling at that level as Litecoin price tries to recover, in an attempt to breakeven on their losing positions, and as a result adding supply and dampening the uptrend. This battle between buyers and sellers will likely continue to $60.00 based on the IOMAP investor cohorts at $53.97, $55.43 and $57.02.
-638012652809053593.png)
Litecoin IOMAP chart
On the other hand, the IOMAP model reveals that Litecoin price lacks firm support to mitigate the ongoing retracement, suggesting it may continue lower.
Yet for all that Litecoin price’s move to $46.64 might be a blessing in disguise for those still stubbornly bullish as it could give buyers time to collect more liquidity before attacking higher levels toward $100.
Author

John Isige
FXStreet
John Isige is a seasoned cryptocurrency journalist and markets analyst committed to delivering high-quality, actionable insights tailored to traders, investors, and crypto enthusiasts. He enjoys deep dives into emerging Web3 tren


