Watch this element to pinpoint the next leg lower in MATIC price action
- Polygon price sees price action being supported for the third week.
- MATIC refrains from making new lows for now, but bulls should act with caution.
- Expect to see a 32% decline unfolding once the supporting technical element breaks.

Polygon (MATIC) price is trying to turn away from its low point of 2022 at $0.319 and bulls are preparing for a possible pop higher. Although a rally would be granted in a typical market environment, the current backdrop suggests otherwise, as markets are still under pressure from inflation woes, recession fears and the tighter market conditions in which traders are operating. The current price action is likely to respect the overall narrative, therefore,resulting in another leg lower towards $0.30.
MATIC price still set up for a 32% drop
Polygon price consolidates this morning in the ASIA PAC and European session on a critical level for price action at $0.450. This level is providing support to price action for the fourth trading day in a row. Additionally, the trend line from the current short-term rally intersects right at the same level, providing further underpinning support to MATIC price. It suggests heavy buying must be taking place currently, as this is likely an irresistible level for bulls to open long positions.
MATIC price will need to be traded cautiously, as the overall narrative is still bearish. Once the trend line breaks, expect a quick deterioration of price action and a nosedive move towards $0.300, with the monthly S1 support level coming in to prevent a further drop towards $0.269. Intrinsically, MATIC could still decline another 32% with the current risk elements in play.
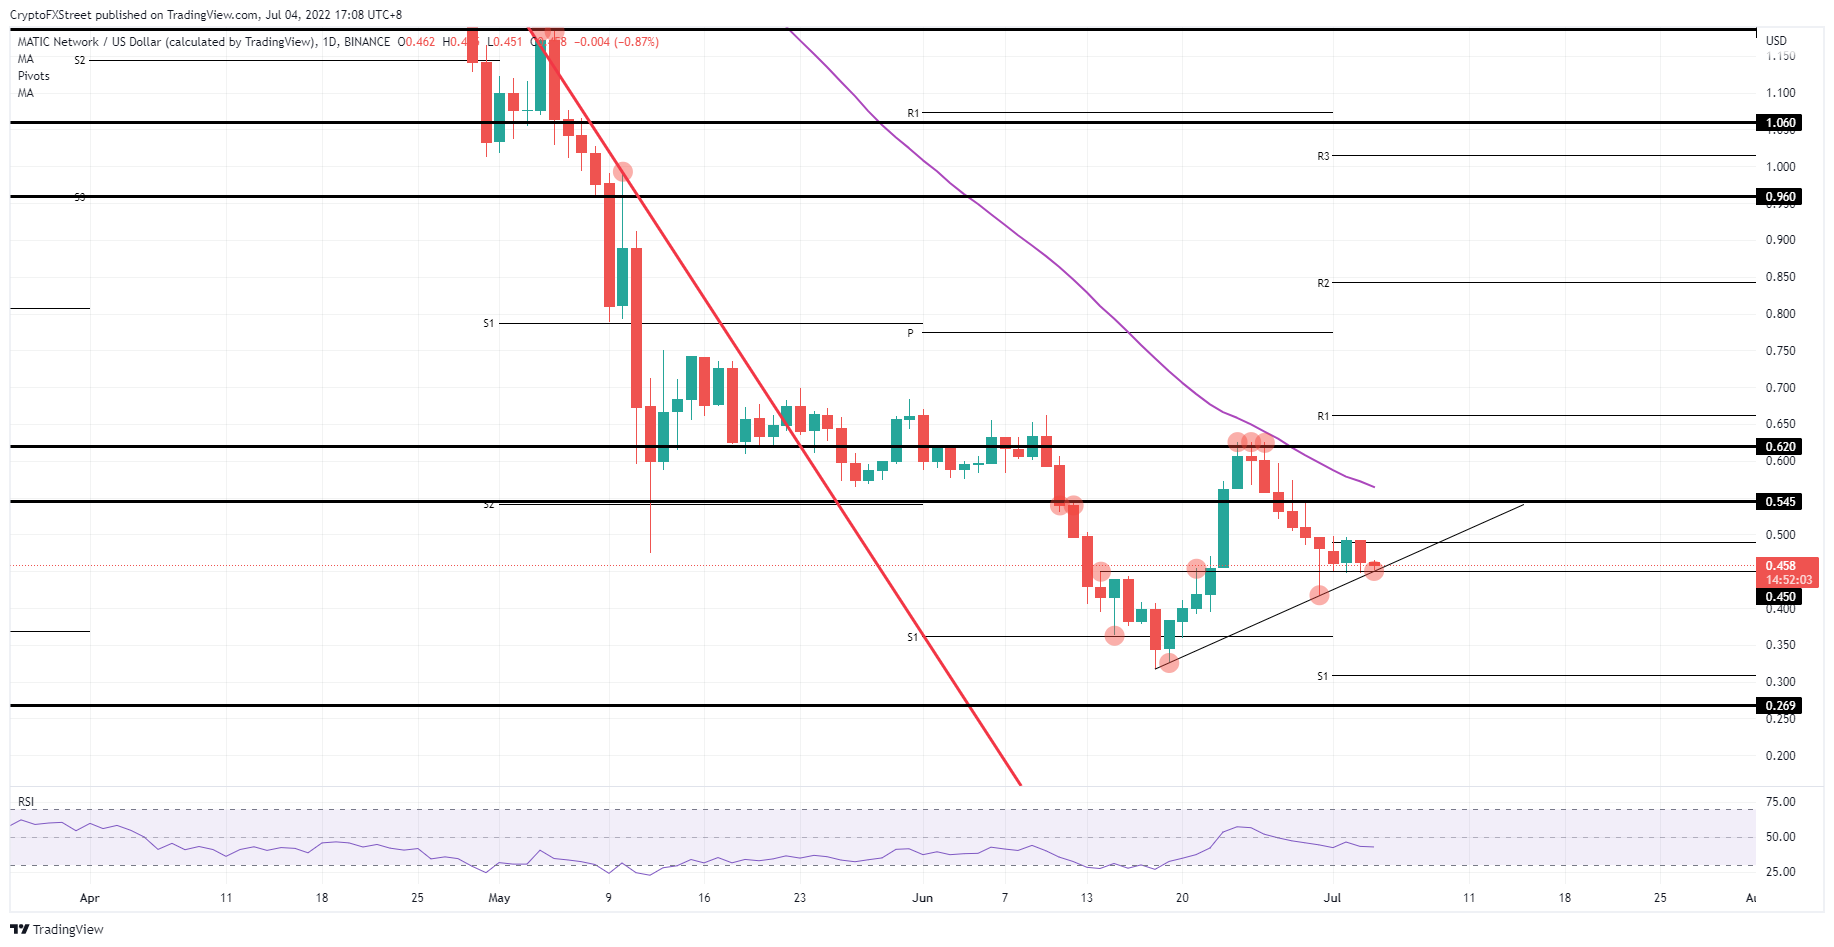
MATIC/USD daily chart
As mentioned in the first paragraph, the rally could continue towards a retest of the monthly pivot at around $0.490. Another leg higher from there would turn the rally into a bullish triangle and test $0.545, with the 55-day SMA nearby capping price action. But it must be underlined that this rally will need to be traded with extreme caution and a tight stop loss because once that ascending trend line breaks, it will trigger a killer nosedive south.
Author

Filip Lagaart
FXStreet
Filip Lagaart is a former sales/trader with over 15 years of financial markets expertise under its belt.


