• VeChain technical indexes present multiple signals ahead of an impending spike.
  • A sharp rise in the demand of VET may kick start a rally to the 100-day SMA.

VeChain price has consistently dropped from its yearly high of $0.023 reached in July. The hunt for a bottom appears to be approaching an end, especially now that multiple technical indexes hint at a recovery. VeChain is ranked 30th in the market and boasts of a market cap of $614 million. Its 24-hour trading volume stands at $178 million.

VeChain rebound seems imminent

The TD Sequential indicator recently presented a buy signal on the daily chart, which gives credence to the bullish outlook. The bullish picture formed as a red nine candlestick, suggesting that an upswing in demand for this token may culminate in prices rising for approximately one to four daily candlesticks. It is worth noting that VET might begin uptrend afresh if the expected buying pressure becomes strong enough.
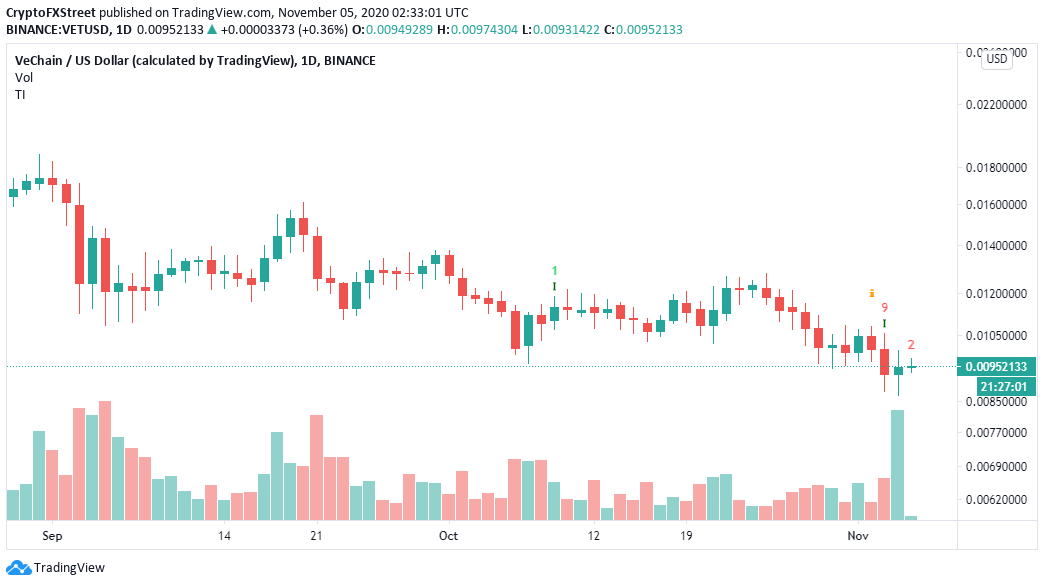
VET/USD price chart

VET/USD 1-day chart

Simultaneously, the bullish argument seems to hold as VeChain fights for a rebound at the lower boundary of a descending parallel channel that developed within the same timeframe. A break above the channel's upper limit may elevate VET to highs of $0.014, as highlighted by the 100 Simple Moving Average (SMA).
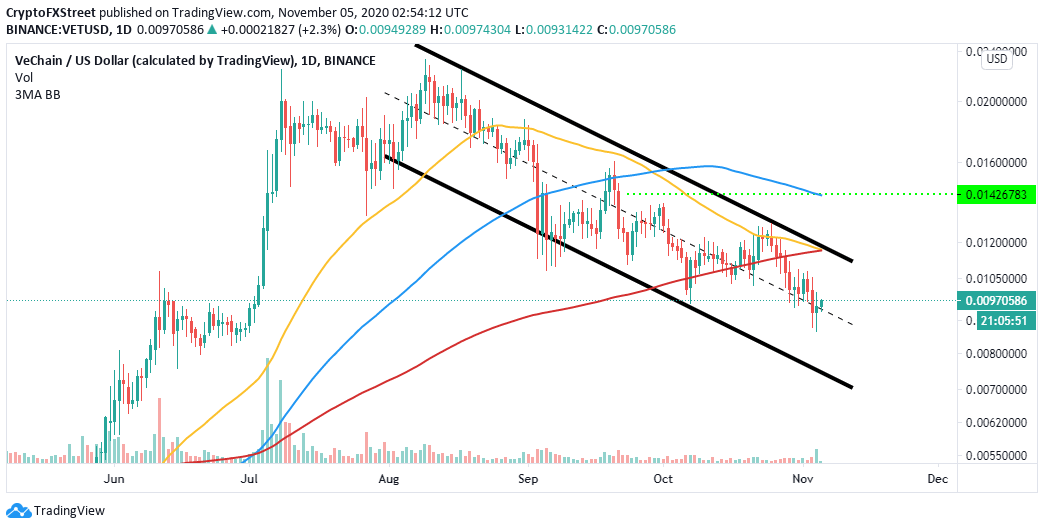
VET/USD price chart

VET/USD 1-day chart

On the other hand, the Relative Strength Index (RSI) emphasizes the bullish outlook. A bullish divergence has been forming between the price and the RSI within the same daily timeframe. It is worth noting that bullish divergences develop when the price creates a lower low pattern while the RSI forms a higher low pattern. Although this technical outlook does not provide a precise buy signal, it shows that the asset's downtrend is nearing exhaustion.
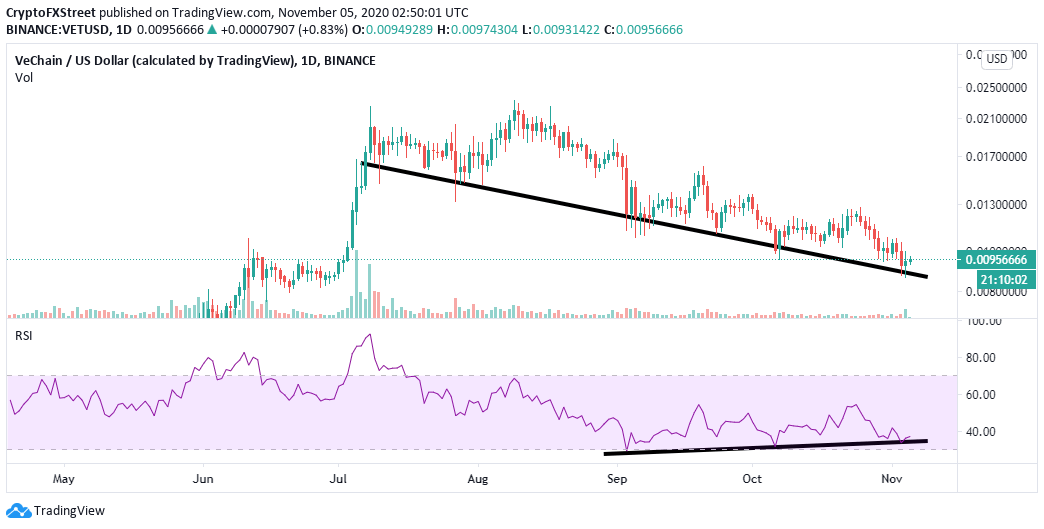
VET/USD price chart

VET/USD 1-day chart

It is worth mentioning that VET/USD must hold above the descending channel's middle boundary to validate the bullish validate narrative. Failure to do so would call for more sell orders, which are likely to pull downwards towards the next key support target at $0.008.


Information on these pages contains forward-looking statements that involve risks and uncertainties. Markets and instruments profiled on this page are for informational purposes only and should not in any way come across as a recommendation to buy or sell in these assets. You should do your own thorough research before making any investment decisions. FXStreet does not in any way guarantee that this information is free from mistakes, errors, or material misstatements. It also does not guarantee that this information is of a timely nature. Investing in Open Markets involves a great deal of risk, including the loss of all or a portion of your investment, as well as emotional distress. All risks, losses and costs associated with investing, including total loss of principal, are your responsibility. The views and opinions expressed in this article are those of the authors and do not necessarily reflect the official policy or position of FXStreet nor its advertisers. The author will not be held responsible for information that is found at the end of links posted on this page.

If not otherwise explicitly mentioned in the body of the article, at the time of writing, the author has no position in any stock mentioned in this article and no business relationship with any company mentioned. The author has not received compensation for writing this article, other than from FXStreet.

FXStreet and the author do not provide personalized recommendations. The author makes no representations as to the accuracy, completeness, or suitability of this information. FXStreet and the author will not be liable for any errors, omissions or any losses, injuries or damages arising from this information and its display or use. Errors and omissions excepted.

The author and FXStreet are not registered investment advisors and nothing in this article is intended to be investment advice.

Join Telegram

Recommended content


Recommended Content

Editors’ Picks

Crypto traders brace for short-term volatility with $2.4 billion options expiry on Friday

Crypto traders brace for short-term volatility with $2.4 billion options expiry on Friday

Bitcoin and Ethereum options market looks bullish on Friday, according to data from intelligence tracker Greeks.live. The firm said it has identified two Bitcoin calls that show an underlying bullish sentiment among market participants. 

More Cryptocurrencies News

XRP recovers from week-long decline following Ripple’s response to SEC motion

XRP recovers from week-long decline following Ripple’s response to SEC motion

Ripple filed a letter to the court to support its April 22 motion to strike new expert materials. The legal clash concerns whether SEC accountant Andrea Fox's testimony should be treated as a summary or expert witness. 

More Ripple News

Lido adds 4% gains as protocol rolls out first step towards decentralization

Lido adds 4% gains as protocol rolls out first step towards decentralization

Lido takes the first batch of simple DVT validators to live, a step taken to decentralize the protocol. Lido leveraged technology to expand the protocol to multiple node operators, inviting both solo and community stakers. 

More Lido News

Bitcoin Weekly Forecast: Should you buy BTC here? Premium

Bitcoin Weekly Forecast: Should you buy BTC here?

Bitcoin (BTC) price shows signs of a potential reversal but lacks confirmation, which has divided the investor community into two – those who are buying the dips and those who are expecting a further correction.

More Bitcoin News

Bitcoin: Should you buy BTC here? Premium

Bitcoin: Should you buy BTC here?

Bitcoin (BTC) price shows signs of a potential reversal but lacks confirmation, which has divided the investor community into two – those who are buying the dips and those who are expecting a further correction.

Read full analysis

BTC

ETH

XRP