VeChain Price Analysis: VET falls below key support level, bears eye drop below $0.01
- VET bears managed to flip the 200-day SMA from support to resistance.
- The Bollinger band has been squeezing in the daily chart, indicating that VeChain is going through price consolidation.

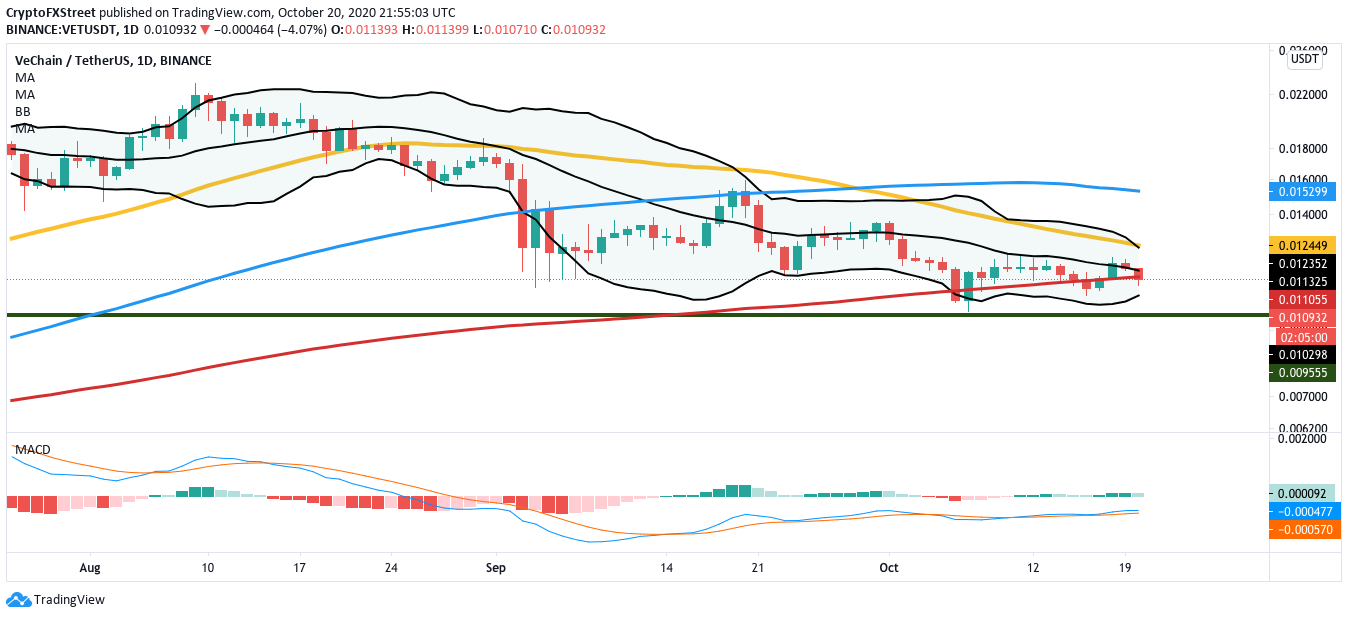
After reaching a high of $0.022 on August 9, VET has been on a downward trend till October 6, reaching $0.0107. Since then, the price has recovered and gone up to $0.0109. The sellers have stayed in control from the second straight day as the price managed to drop below the 200-day SMA ($0.011). The Bollinger Band in the daily chart has started to compress, which shows that VeChain has entered a period of consolidation.
VET/USDT daily chart
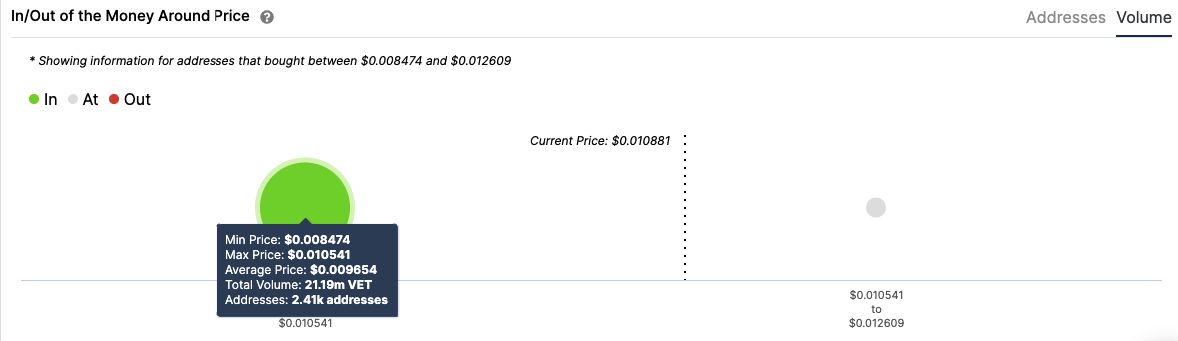
After a period of price compression, what often follows is a price breakout, and it looks like this breakout will be bearish. If that does happen, the IOMAP shows us that the downside is capped at $0.0095. Previously at this barrier, 2,400 addresses had purchased 21.2 million VET. A break below this will see the price drop to $0.007.
VET IOMAP
The Flipside: Can the bulls still turn this around?
The immediate goal for the buyers will be to flip back the 200-day SMA from resistance to support. Upon doing that, they could aim for the 50-day SMA (0.125). The MACD still shows that the market momentum is bullish. Another positive sign is Santiment’s social volume chart. The lack of spikes shows that FUD hasn’t triggered the recent price drop.
VET social volume
 [04.06.50, 21 Oct, 2020]-637388319704874700.png)
Key price levels to watch
The $0.0095 support wall is critical for the bears since a drop below that will see VET drop to $0.007. The VeChain sellers will attempt to make this fall by taking advantage of the 200-day SMA ($0.011), recently flipped from support to resistance.
The bulls can take back control by flipping back the 200-day SMA from resistance to support. Following this, they will look to push the price up to the 50-day SMA (0.125).
Author

Rajarshi Mitra
Independent Analyst
Rajarshi entered the blockchain space in 2016. He is a blockchain researcher who has worked for Blockgeeks and has done research work for several ICOs. He gets regularly invited to give talks on the blockchain technology and cryptocurrencies.


