VeChain Technical Analysis: VET upside capped at $0.015
- VeChain has flashed a buy signal in the 4-hour chart.
- IntoTheBlock’s “In/Out of the Money Around Price” (IOMAP) model estimates that VeChain’s upside potential is at $0.015.

The 4-hour VET/USD has broken above the downward trending line and the 100-day Simple Moving Average (SMA 100). In the process, the TD sequential has flashed a buy signal. The MACD has reversed from bearish to bullish, which shows that more bullish price action is expected.
VET/USD 4-hour chart
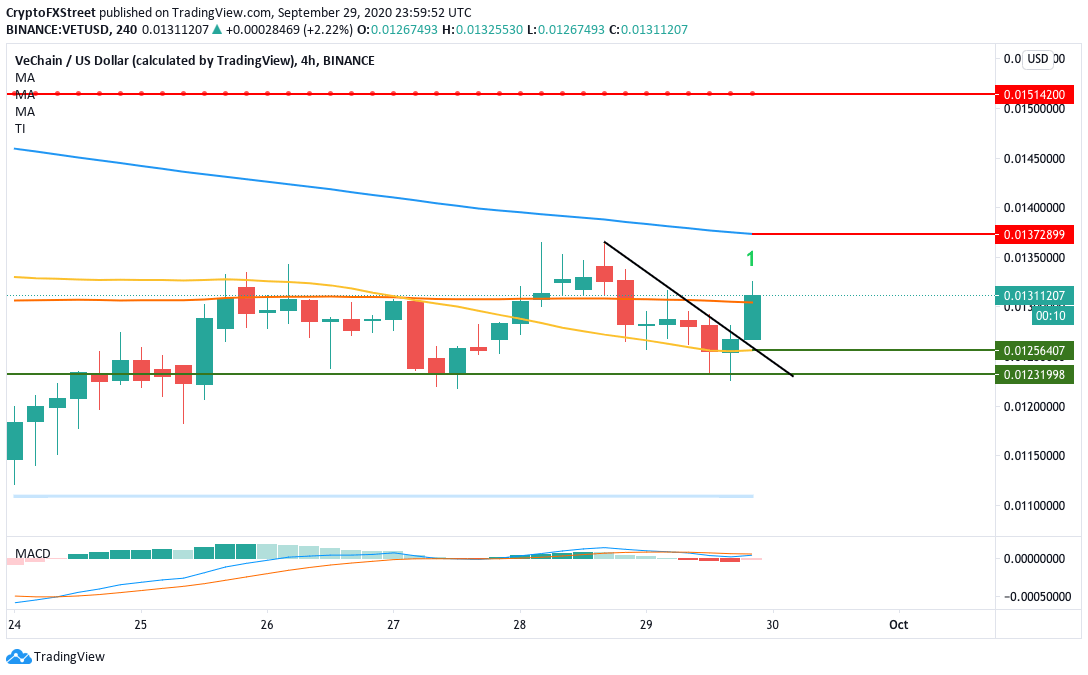
To make the most of this uptrend, the price should first aim for the SMA 200 curve ($0.0137). If the buyers manage to do so, one can expect VET/USD to jump up to the $0.015 resistance level (as defined by the TD sequential). The IOMAP also defines this upside.
VET IOMAP
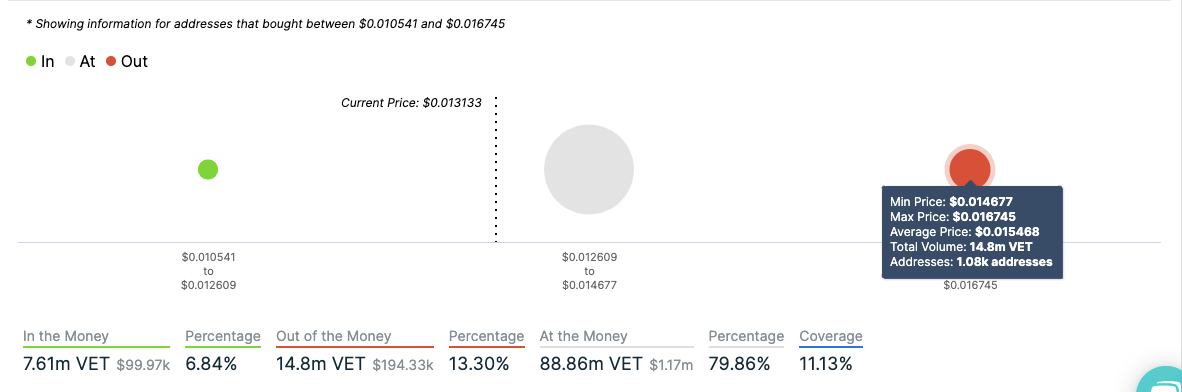
IntoTheBlock’s “In/Out of the Money Around Price” (IOMAP) model estimates that VeChain’s upside potential is at $0.0156. Here, over 1,080 addresses had previously purchased more than 14.8 million VET.
VET/USD 12-hour chart
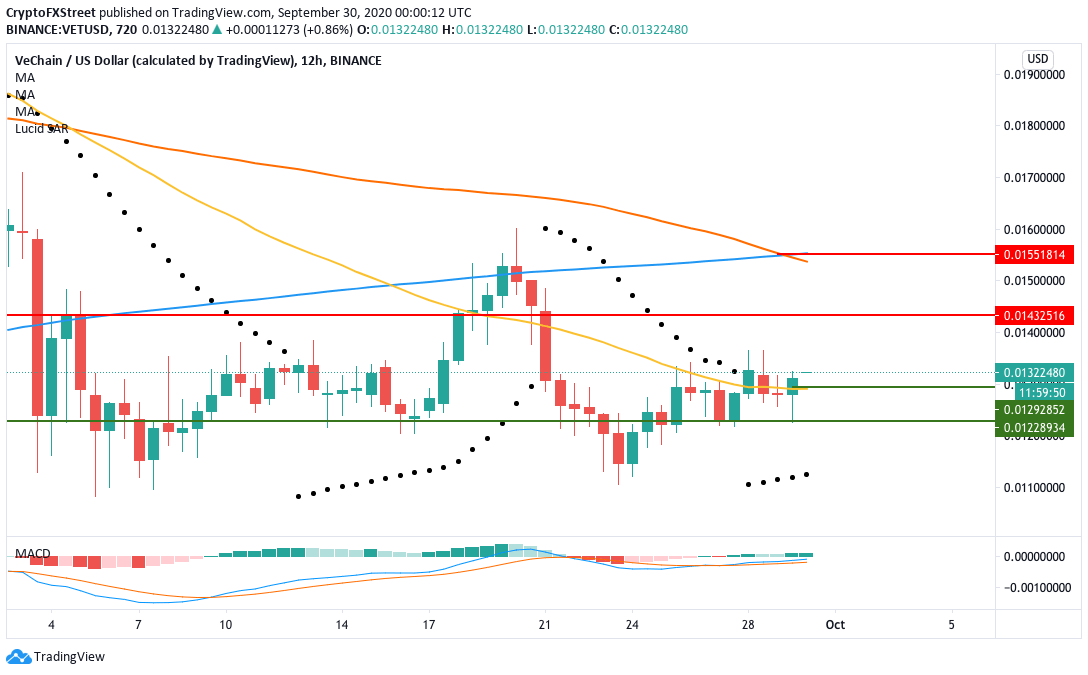
In the 12-hour timeframe, the parabolic SAR for VET has reversed its trend from bearish to bullish. At the same time, the MACD shows increasing bullish momentum. To consolidate this positive move, VET will aim for the $0.0143 and the $0.015 resistance lines. The following will allow VET to cross above the SMA 100 and SMA 200 curves.
VET/USD daily chart
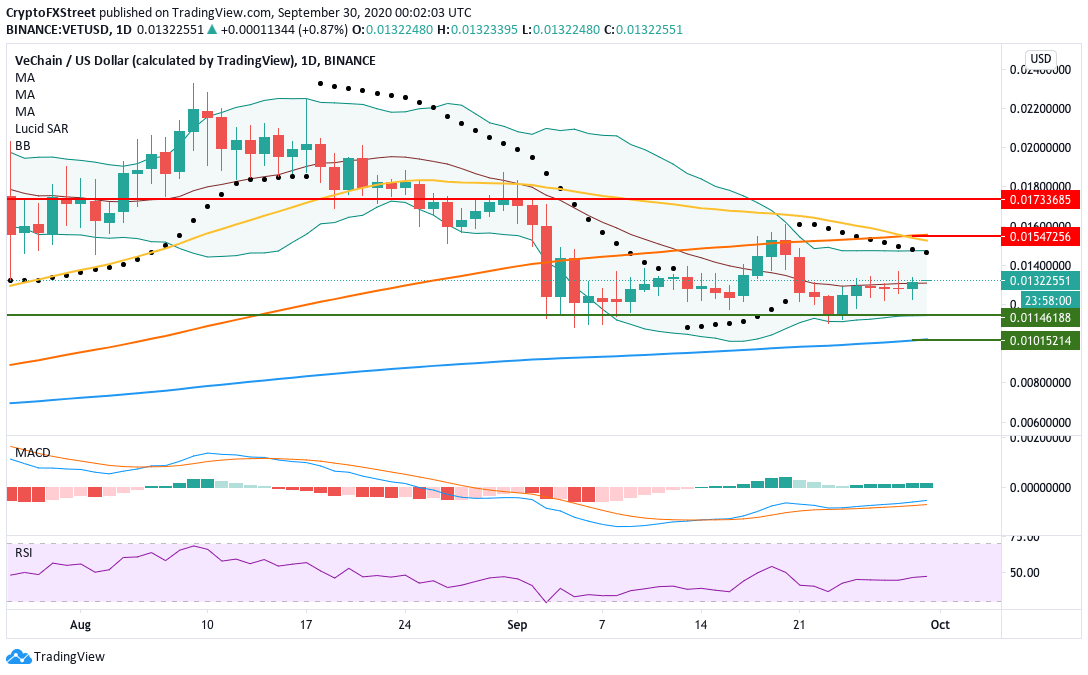
In the daily chart, VET has been trending in the lower half of the Bollinger band for nine sessions, before the latest candlestick finally managed to break above the middle band.
The parabolic SAR shows that the trend in the daily chart is presently bearish. VET needs to break above the upper Bollinger band ($0.0146) to reverse this trend. The relative strength index (RSI) is trending around 45.65, giving the buyers enough space to grow the price before the asset becomes overvalued.
VET Social Volume
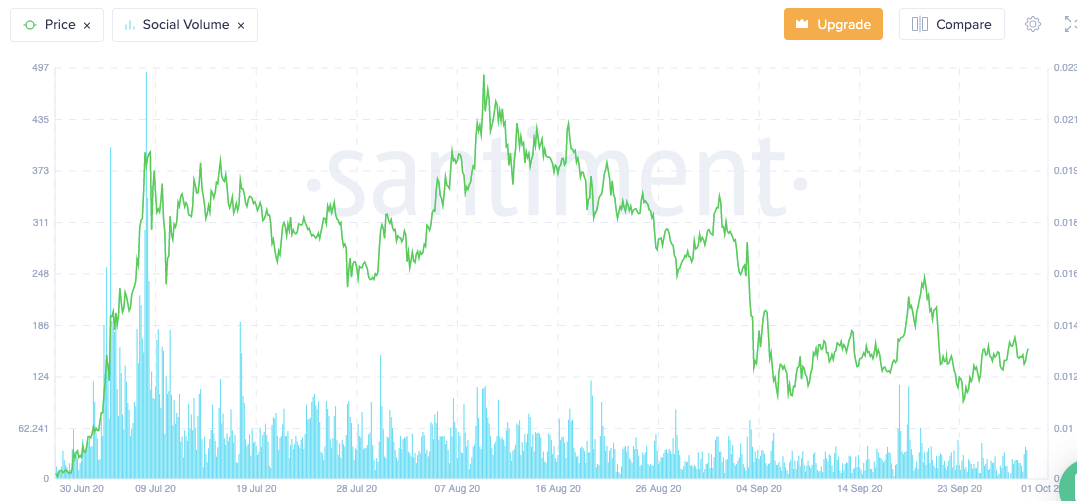
Santiment’s social volume metric shows the number of mentions of the coin on 1000+ crypto social media channels, including Telegram groups, crypto subreddits, discord groups, private trader chats, and more. Social volume spikes often lead to a short-term pump followed by an immediate dump.
This can be seen around July 2020. On 5th and 8th July, there were two significant spikes in the social volume, which caused the price to jump from $0.0143 to $0.0198, which was followed by an immediate dump to $0.0154
As per the chart, the social volume has had not had a significant spike since the last 12 days. What this tells us is that VET is comparatively under the radar and free from unnecessary social media hype and FUD.
Author

Rajarshi Mitra
Independent Analyst
Rajarshi entered the blockchain space in 2016. He is a blockchain researcher who has worked for Blockgeeks and has done research work for several ICOs. He gets regularly invited to give talks on the blockchain technology and cryptocurrencies.


