Uniswap price heads lower while UNI looks for the bottom
- Uniswap price downward trend looks to bottom out as risk sentiment in the markets picks up again.
- UNI price at 17.66$ looks to be defended for now as we need to go back to February 23 when this level last held
- Support levels might be forming for long positions as talks of liquidity mining return.

Uniswap price against the dollar has been worrying investors these past few days. However, the tide may be turning here as price stretches lower to reach a previously tested support level.
Uniswap price ready for the return higher
On May 5, Uniswap still traded around $48.13. Since then, it has been trading constantly lower, with Uniswap prices stuck in a downward spiral for almost 50 days now. On-chain metrics display that the cryptocurrency was bought at multiple levels, especially after big corrections. This illustrates that a buy-the-dip mantra is in effect and seems to be doing the trick for now.
Who here has the guts to catch a falling knife and go long if the crypto corrects 60% in one trading session? With a potential downside move still imminent, traders should remain cautious during volatile price action.
The Fibonacci levels do not really tell a compelling story either. UNI broke each time several important levels were reached, such as the 0.382 and 0.236 levels. This is where we even saw Uniswap price action retrace back to the next day before trending lower once again. No new highs have been triggered since the May 19 crash.
Uniswap price action has become a bit rational which becomes quite interesting when creating trade setups. Price movements have also become more in line with the general risk sentiment. So this is a good time to keep your ear to the streets and look for changes in sentiment while remaining watchful for buy-the-dip opportunities. Hopefully, this time will be more sustainable.
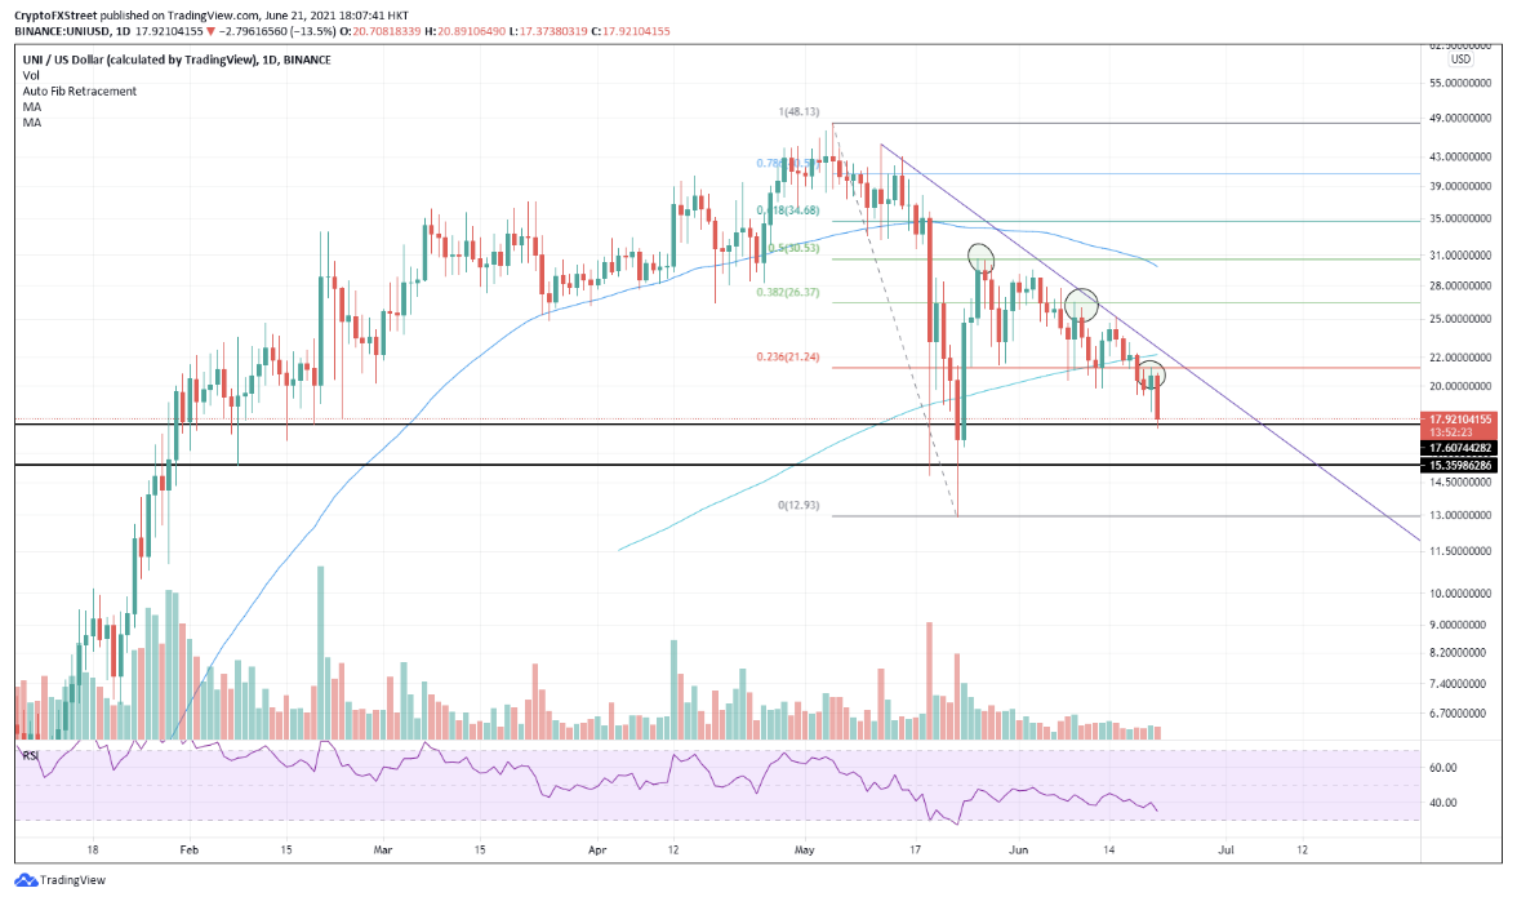
UNI/USDt 1-day chart
Although sellers are in control, look for a pickup in buying activity behind Uniswap price between $17.60 and $15.40 range. That should be a zone where a lot of sellers will be ready to take profit and buyers can take over control.
This could even be a very nice long if Uniswap price could break above the downward trendline since May 12. As an extra, the RSI looks ready for a buy one it dips below 30.
Author

FXStreet Team
FXStreet
Composed of a group of economic journalists and FX experts, the FXStreet content team produces and oversees all content published on FXStreet. It provides a purely journalistic approach to the Forex market.




