Uniswap Price Prediction: UNI woes multiply as major red flags pop up
- Uniswap price could undo its 115% rally since May 23 as MRI flashed a sell signal.
- Transactional data shows a massive cluster of underwater investors that might deter the upswing.
- Declining daily active addresses adds credence to the UNI bearish narrative.

Uniswap price has seen a tremendous run-up since the crash on May 23. This recovery rally could be in trouble as a sell signal threatens to wipe these gains.
Uniswap price awaits a hostile takeover from bears
Uniswap price has rallied roughly 30% over the past 18 hours but fell short of producing a higher high above the recent swing point at $28.46. This lack of buying pressure is due to the overextended nature of the recent run-up, combined with the 50 six-hour Simple Moving Average (SMA) acting as a resistance barrier, coinciding with $28.46.
To make matters worse for the bulls, the Momentum Reversal Indicator (MRI) has flashed a reversal sign in the form of a red ‘one’ candlestick on the six-hour chart, suggesting that this upswing has reached its peak.
Furthermore, this setup forecasts a one-to-four candlestick correction, which adds impetus to the said bearish thesis. Moreover, the 50 six-hour SMA has slithered close to the 100 six-hour SMA and ponders a move below it. If such a development were to occur, it would denote a bearish crossover, adding a tailwind to the pessimistic scenario explained above.
Therefore, investors can expect UNI to drop 20% to $21.51, the recent swing low formed on May 25. If the sellers overwhelm this level, Uniswap price will likely slide another 15% to tag the support level at $18.37.
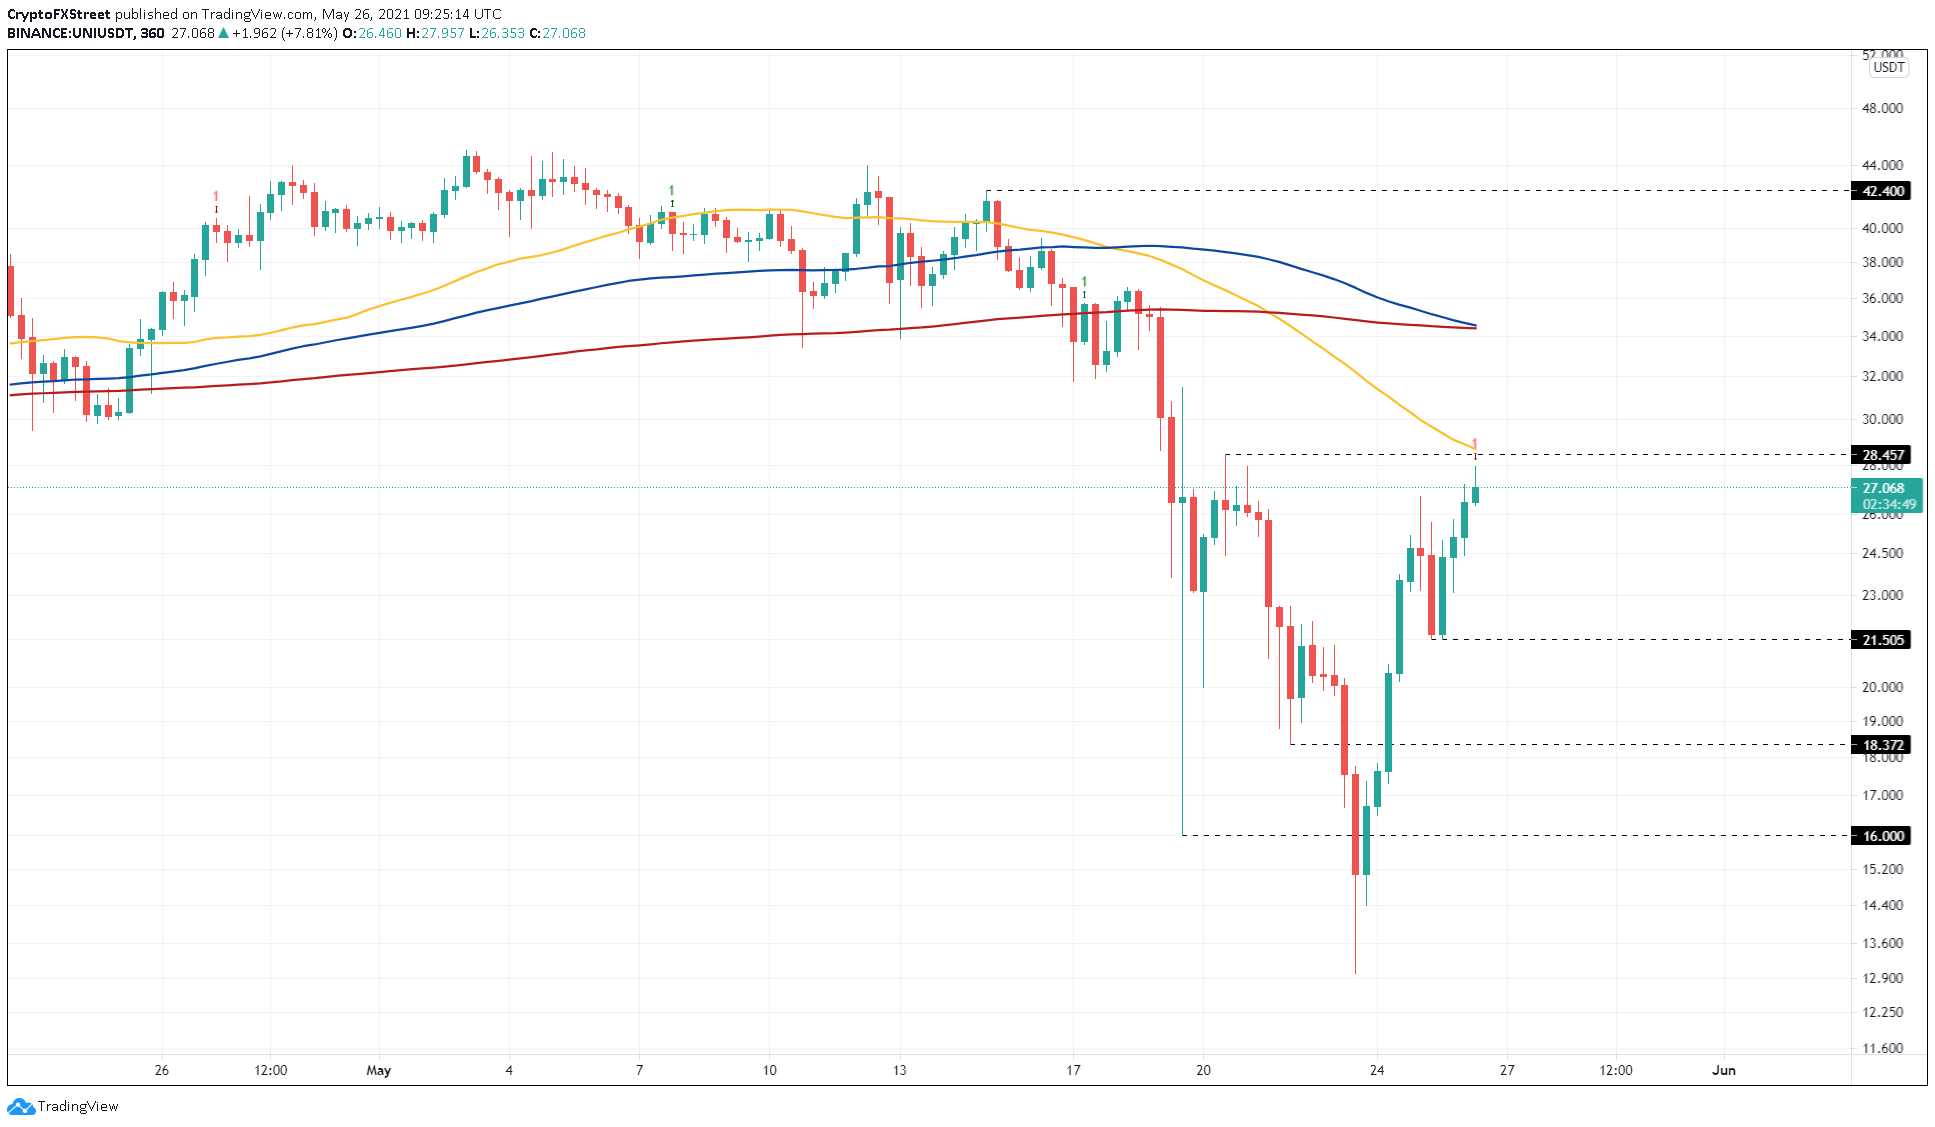
UNI/USDT 6-hour chart
Further supporting the decline for Uniswap price is IntoTheBlock’s In/Out of the Money Around Price (IOMAP) model, which shows a cluster of underwater investors present ahead.
Roughly 10,400 addresses that purchased nearly 245 million UNI at an average price of $28.14 are “Out of the Money.”
These holders might want to break even if Uniswap price rises to $28.14, thereby adding more selling pressure and dampening the bullish momentum.
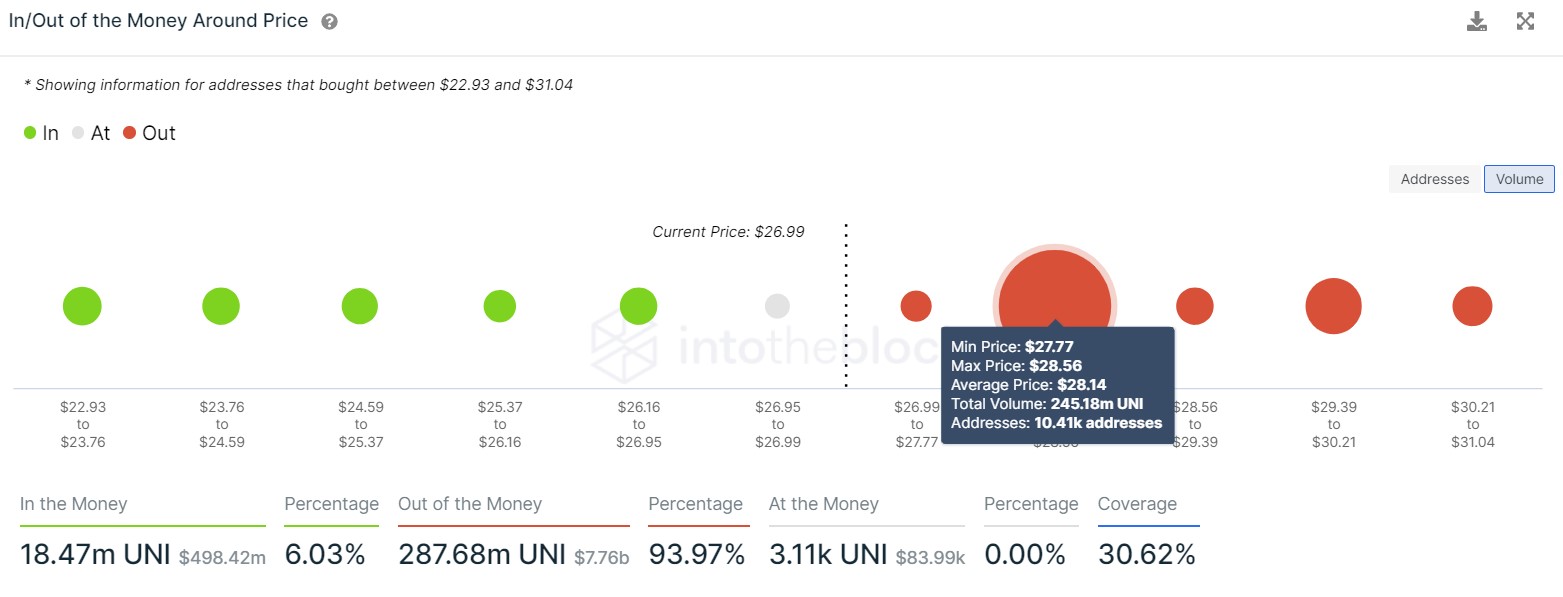
UNI IOMAP chart
The number of new active addresses joining UNI has dropped from 2,760 on April 25 to 1,340 to date. This 51% decline indicates that the investors are either reallocating their holdings or booking profit. Hence, this metric also paints a bearish picture, suggesting that a drop in Uniswap price seems inevitable.
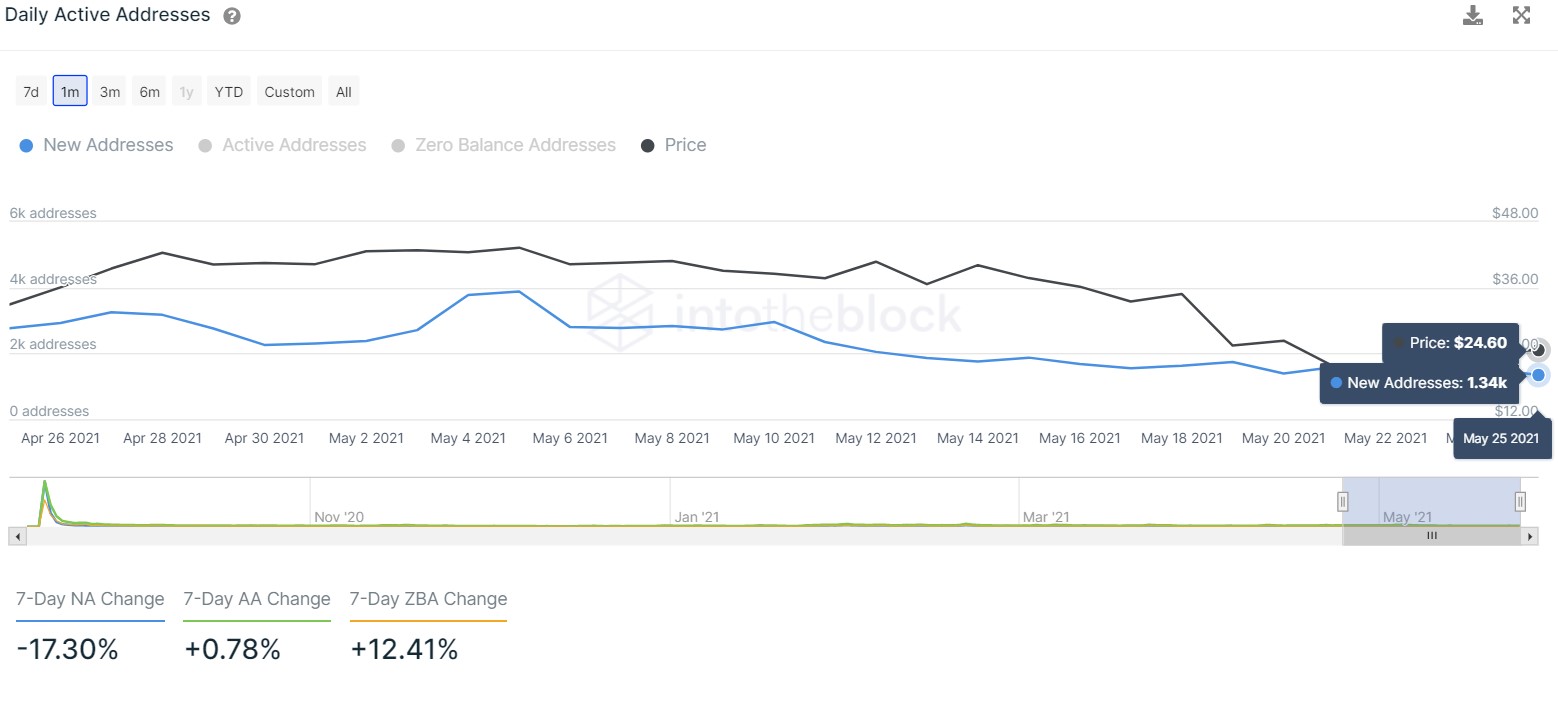
UNI new active addresses chart
While things look gloomy for the DeFi coin, a decisive close above the conjunction of the 50 and the 100 six-hour MAs at $35.45 will invalidate the bearish thesis referenced above.
In that case, Uniswap price may rally 22% to $42.40.
Author

Akash Girimath
FXStreet
Akash Girimath is a Mechanical Engineer interested in the chaos of the financial markets. Trying to make sense of this convoluted yet fascinating space, he switched his engineering job to become a crypto reporter and analyst.




