Uniswap price direction uncertain, UNI needs time to consolidate
- Uniswap price falls 60% from May 3 high to yesterday’s panic low.
- UNI decline overruns the strategically important 200-day simple moving average (SMA).
- Uniswap v3 rises to second-largest decentralized exchange (DEX) by volume.

Uniswap price fell 53% yesterday at the intra-day low before rebounding 40% to close well above the strategically important 200-day simple moving average (SMA). The magnitude of the bounce coupled with improving fundamentals leaves UNI in a position for a relatively tight consolidation for the foreseeable future.
Uniswap v3 volume augmented by the dog-token frenzy
Within two weeks, Uniswap v3 is now ranked as the second-largest Ethereum-based decentralized finance protocol (DeFi) on the Ethereum mainnet. According to Messari, “Uniswap V3 reached 81% of the volume as Uniswap V2” and had processed $6.5 billion of weekly volume, more than the major Ethereum-based Dex competitor SushiSwap with $5.6 billion. Further down the list were Ox, Curve, Balancer and Bancor as other competitors.
The bullish volume figures have been boosted by the euphoric dog-token speculation that catalyzed the markets in early May. The Shiba Inu / Ether (SHIB) pair was the top v3 pair by fees generated and the number of trades. Akita Inu and Dogelon Mars ranked in the top six by the number of trades.
Uniswap v3 has been criticized for not meeting expectations and its promise of gas fee reduction. However, the insanely high transaction fees have not stopped users from capitalizing on the platform.
Uniswap price humbled, but not KO’d by crypto slide
From February 21 to May 18, Uniswap price transacted in an ascending channel. The 50-day SMA proved pivotal during pullbacks within the channel, and volume remained below average. Still, the daily Relative Strength Index (RSI) began showing a bearish momentum divergence at the March high, which continued through the May high.
A bearish momentum divergence occurs when the RSI does not print a new high along with price, signifying a decline in momentum for the cryptocurrency.
Yesterday, Uniswap price collapsed below the channel’s lower trend line and quickly declined below the 200-day SMA and the 61.8% Fibonacci retracement of the rally that began in November 2020 at $18.28. At the intra-day low Uniswap price was down 60% from the May 3 high and 50% for the day. By the end of trading yesterday, UNI had rallied 40% from the low, positioning it above the major moving average.
Uniswap price will need time to adjust and release the price compression generated by yesterday’s volatility, but as long as it remains above the 200-day SMA, the outlook is constructive.
The price range defined by the 38% and 50% retracement levels between $27.39 and $30.76 will be influential during price surges. If Uniswap price rises above $30.76, it will hit a new resistance level built by the channel’s lower trend line at $31.60. Thus, limiting the upside for UNI to about 20% in the short term.
It is important to note that the daily Relative Strength Index (RSI) did reach a similar oversold reading that coincided with the November 2020 low. It improves the prospects for UNI moving forward.
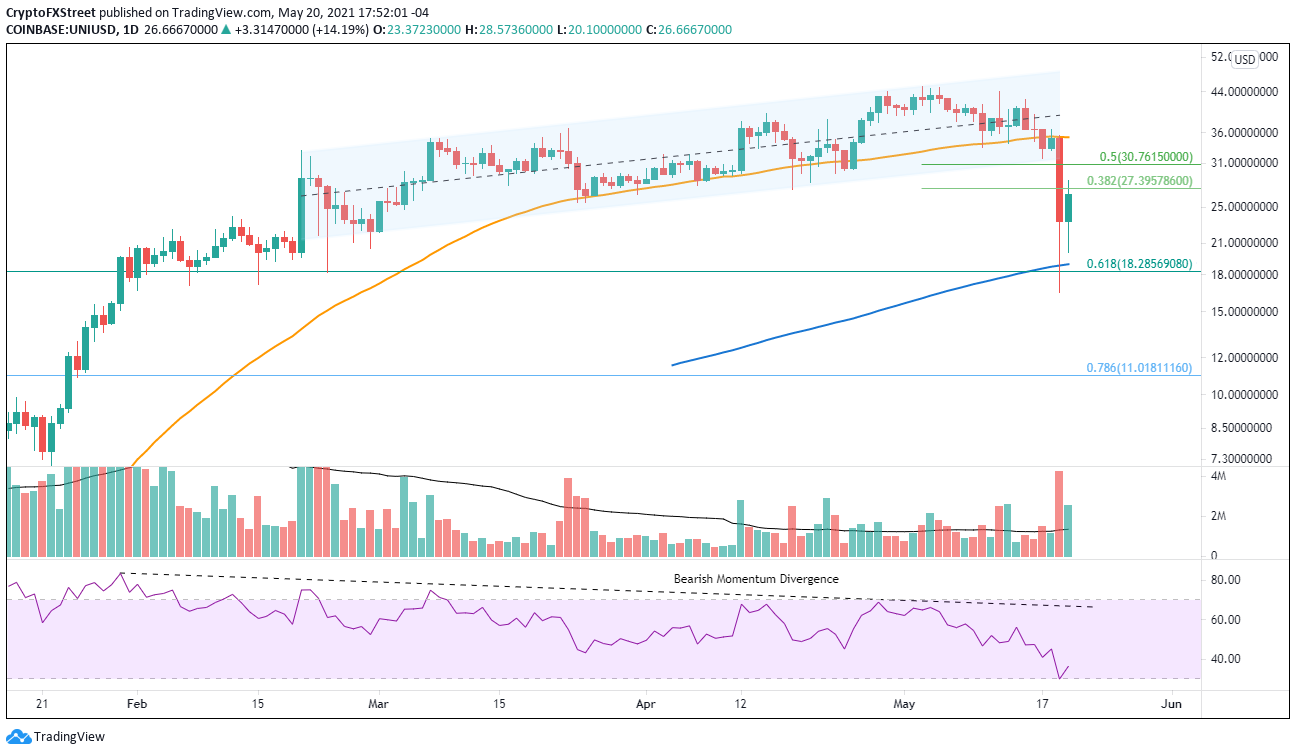
UNI/USD daily chart
Any UNI selling needs to be contained by the 200-day SMA at $18.93 or the odds of a test of yesterday’s low at $16.50 rises significantly. Below $16.50, there is no explicit support until the 78.6% retracement of the rally that began in November 2020 at $11.01.
With upside limited to 20%, investors would be better to wait for a pullback near the 200-day SMA or the emergence of a pattern with an exact entry price before engaging Uniswap price from the long side.
Author

Sheldon McIntyre, CMT
Independent Analyst
Sheldon has 24 years of investment experience holding various positions in companies based in the United States and Chile. His core competencies include BRIC and G-10 equity markets, swing and position trading and technical analysis.




