Uniswap Price Forecast: UNI primed for 25% surge as it rides bullish wave
- Uniswap price is traversing an ascending parallel channel consolidation since February 20.
- A bounce from the lower trend line suggests a 25% upswing to the upper boundary.
- Transactional data and other on-chain metrics add to UNI’s bullish thesis.

The Uniswap price is undergoing a bounce that could propel it closer toward the upper boundary of a technical pattern.
Uniswap price primed for new highs
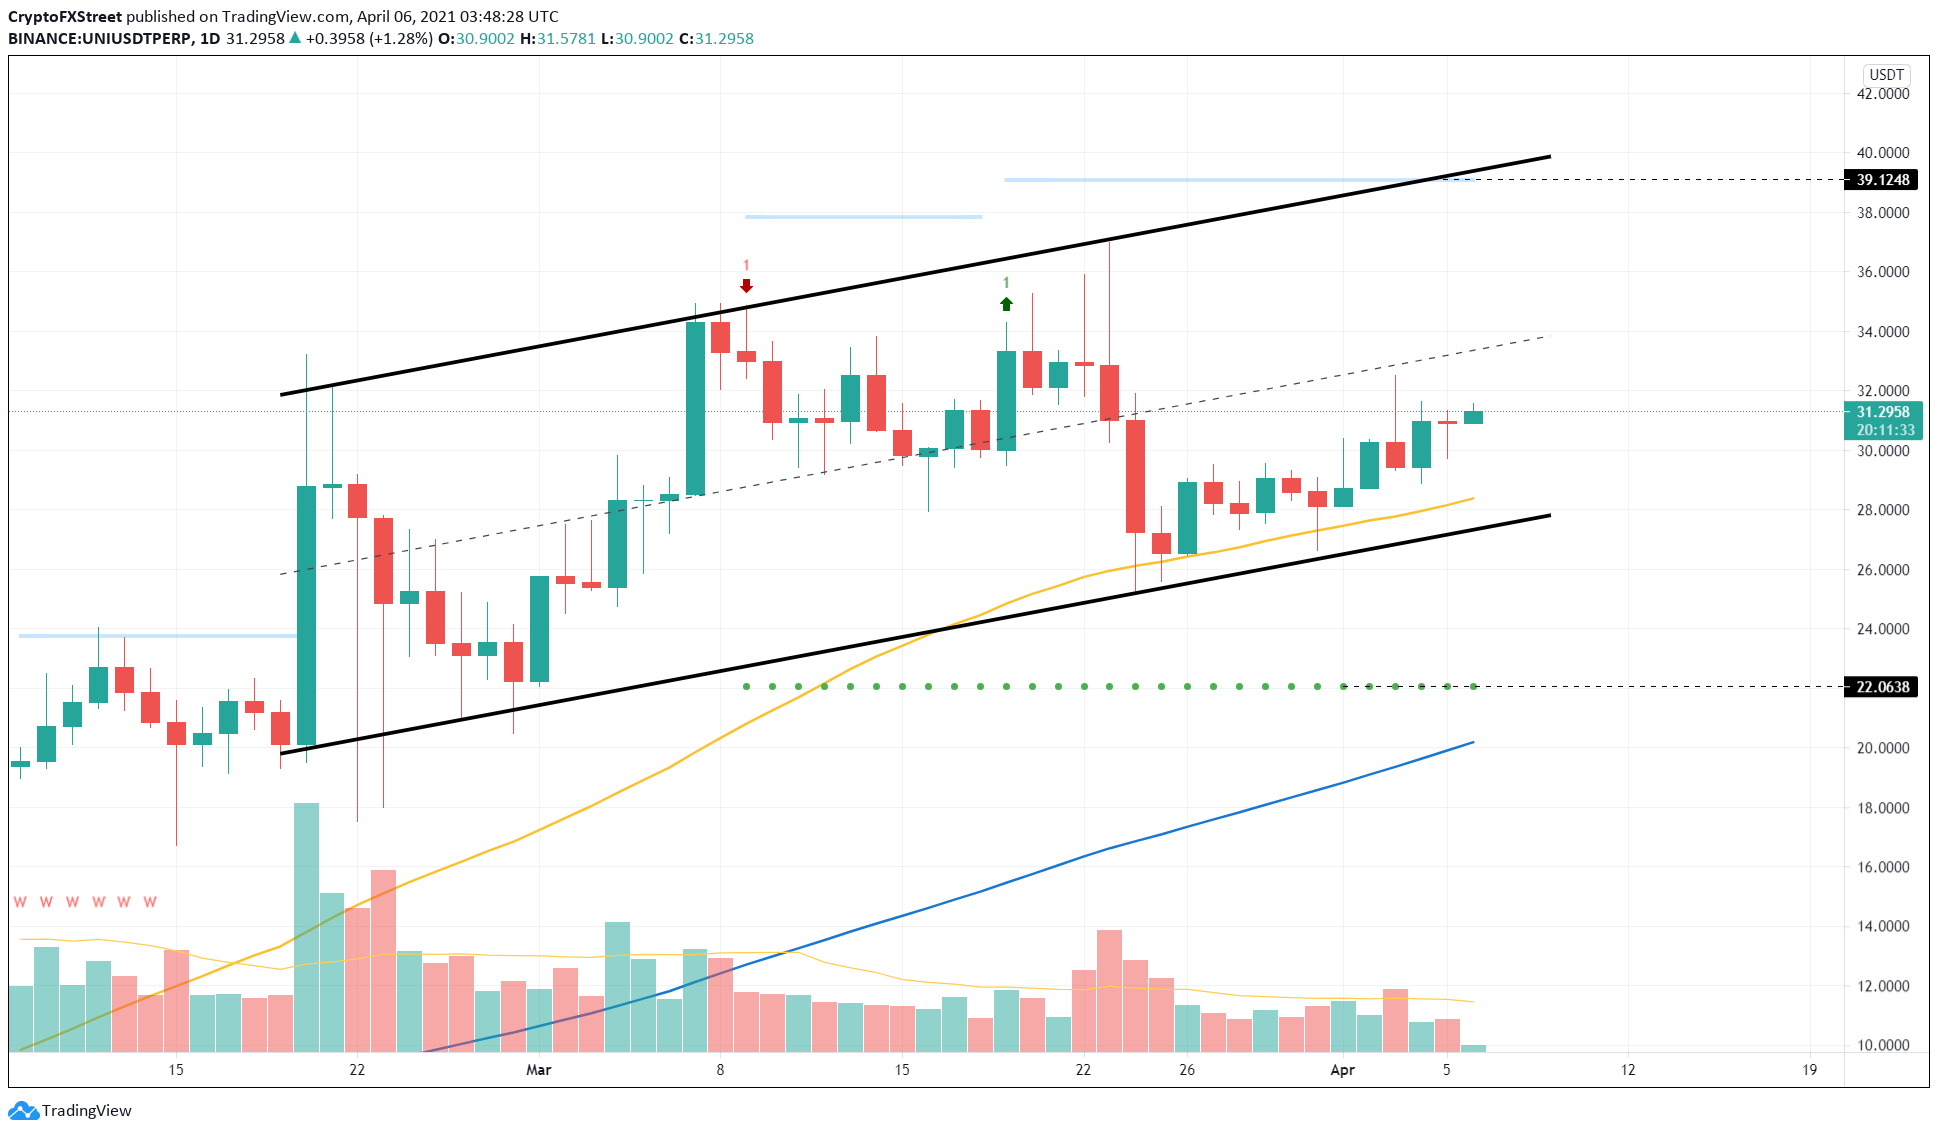
On the twelve-hour chart, the Uniswap price has created an ascending parallel channel formed by connecting the series of higher highs and higher lows using trend lines. This technical formation has a bearish bias that is triggered only after the lower boundary is shattered.
At the time of writing, UNI seems to have produced a 16% surge after setting up the third swing low. A continuation of this upswing will mean a 25% bull rally toward the upper trend line at $39.12.
UNI/USDT twelve-hour chart
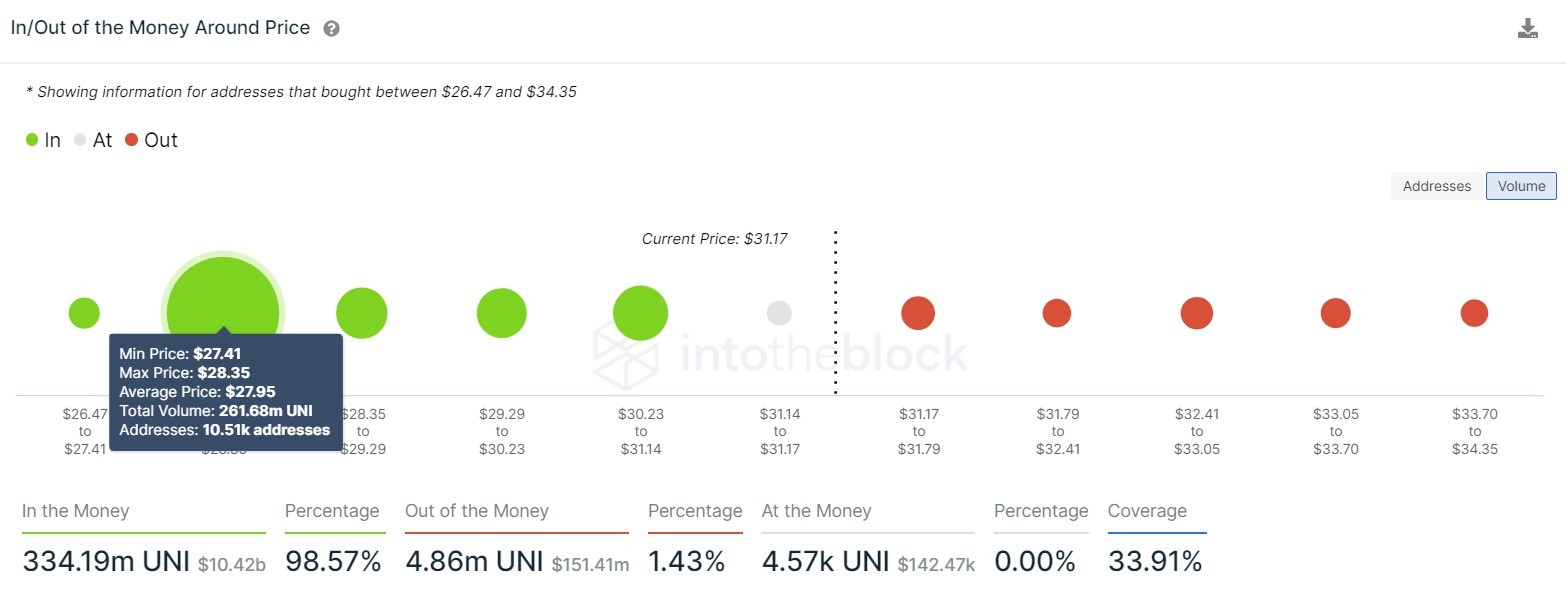
Adding credence to the buyers’ narrative is IntoTheBlock’s In/Out of the Money Around Price (IOMAP) model revealing that 10,500 addresses holding roughly 261 million UNI tokens were purchased at an average price of $27.95.
Hence, these investors will absorb any short-term bearish momentum. On the flip side, the density of resistance levels is relatively low, suggesting a slight surge in buying pressure could topple these barriers.
Uniswap IOMAP chart
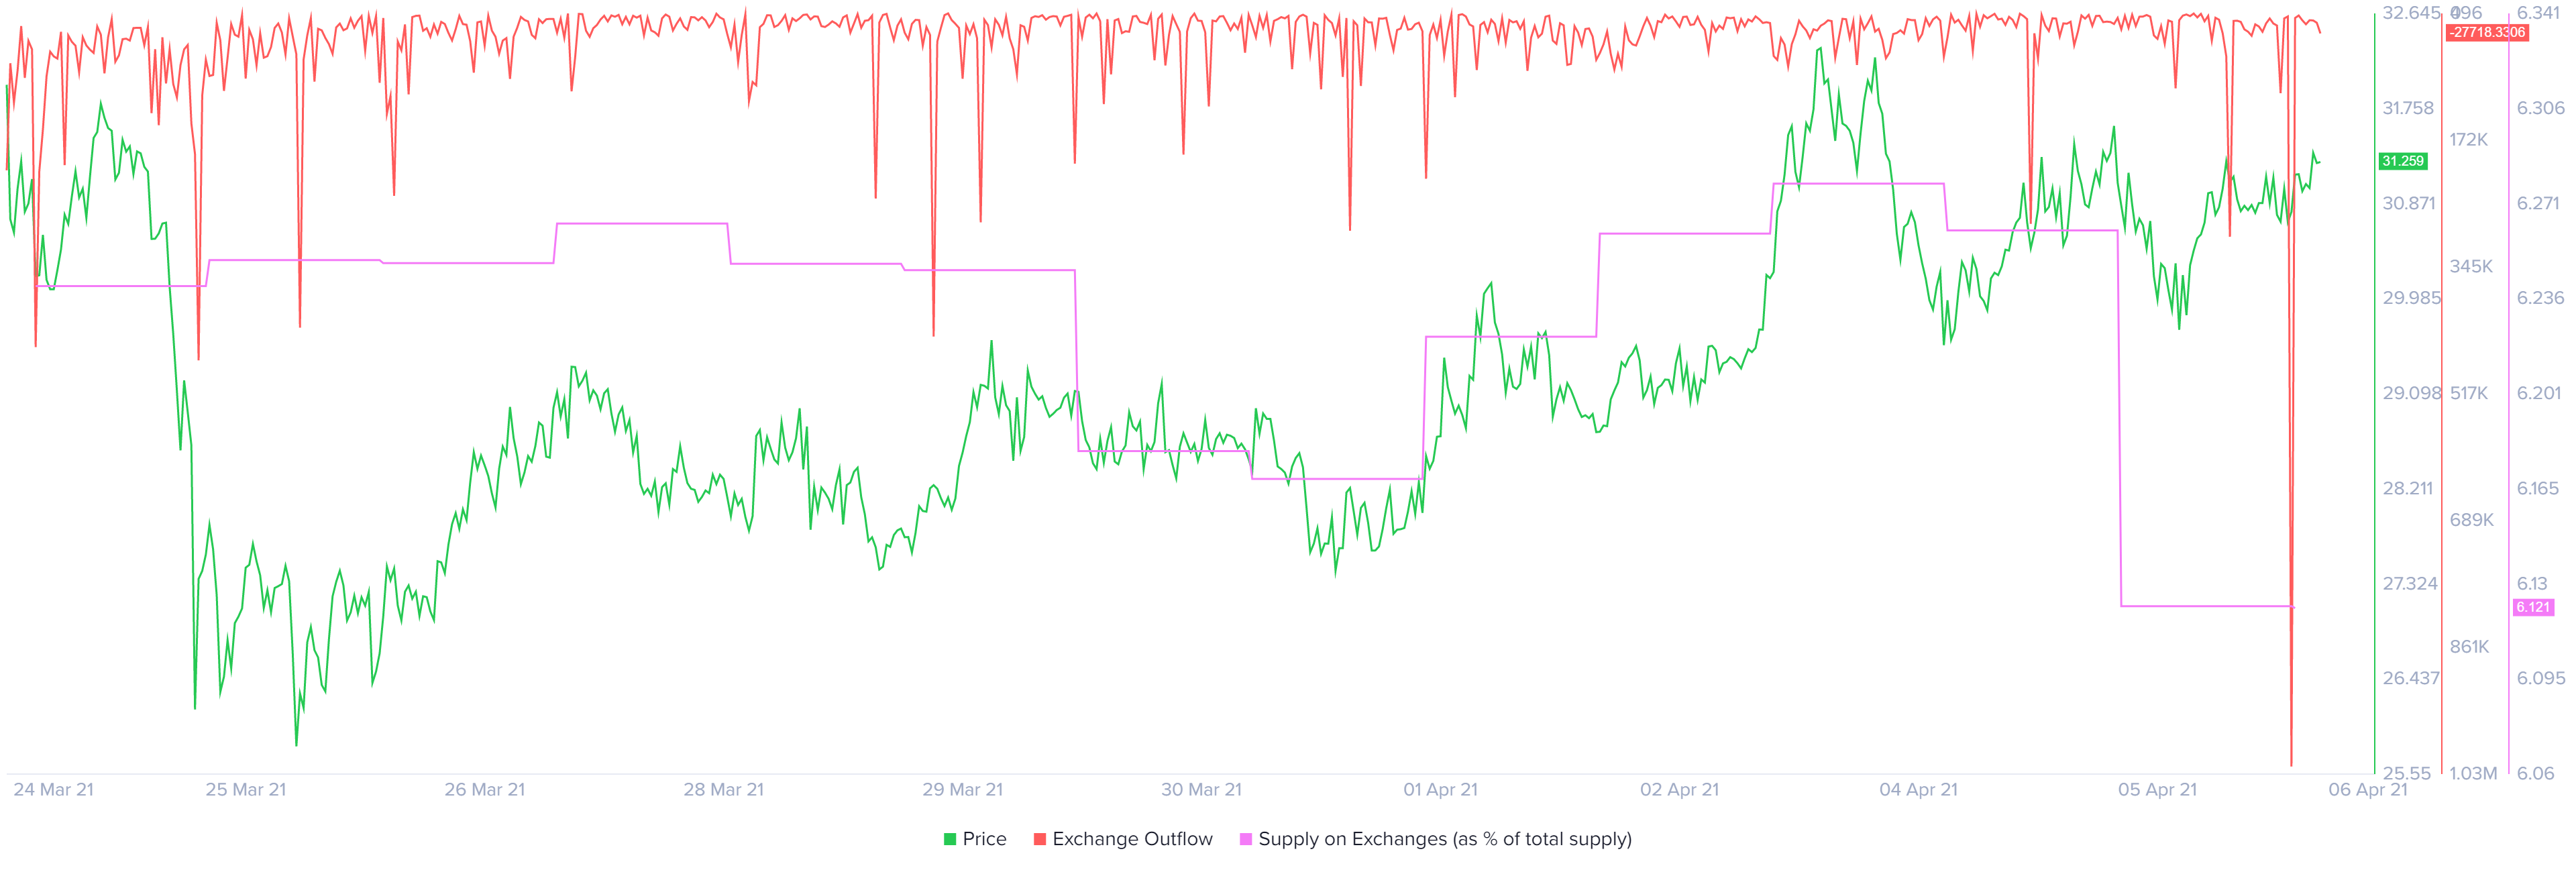
Supporting this upswing narrative for the DeFi coin is a massive spike in exchange outflow for UNI tokens. Specifically, 1 million UNI tokens moved out of exchange platforms, suggesting that the investors are optimistic about Uniswap’s bullish potential.
Additionally, the supply of UNI tokens on exchanges as a percent of total supply saw a 2.5% reduction since April 3.
Both the metrics display a reduced number of UNI tokens on exchange platforms, which is bullish since it effectively reduces the selling pressure.
Uniswap exchange outflow and exchange supply chart
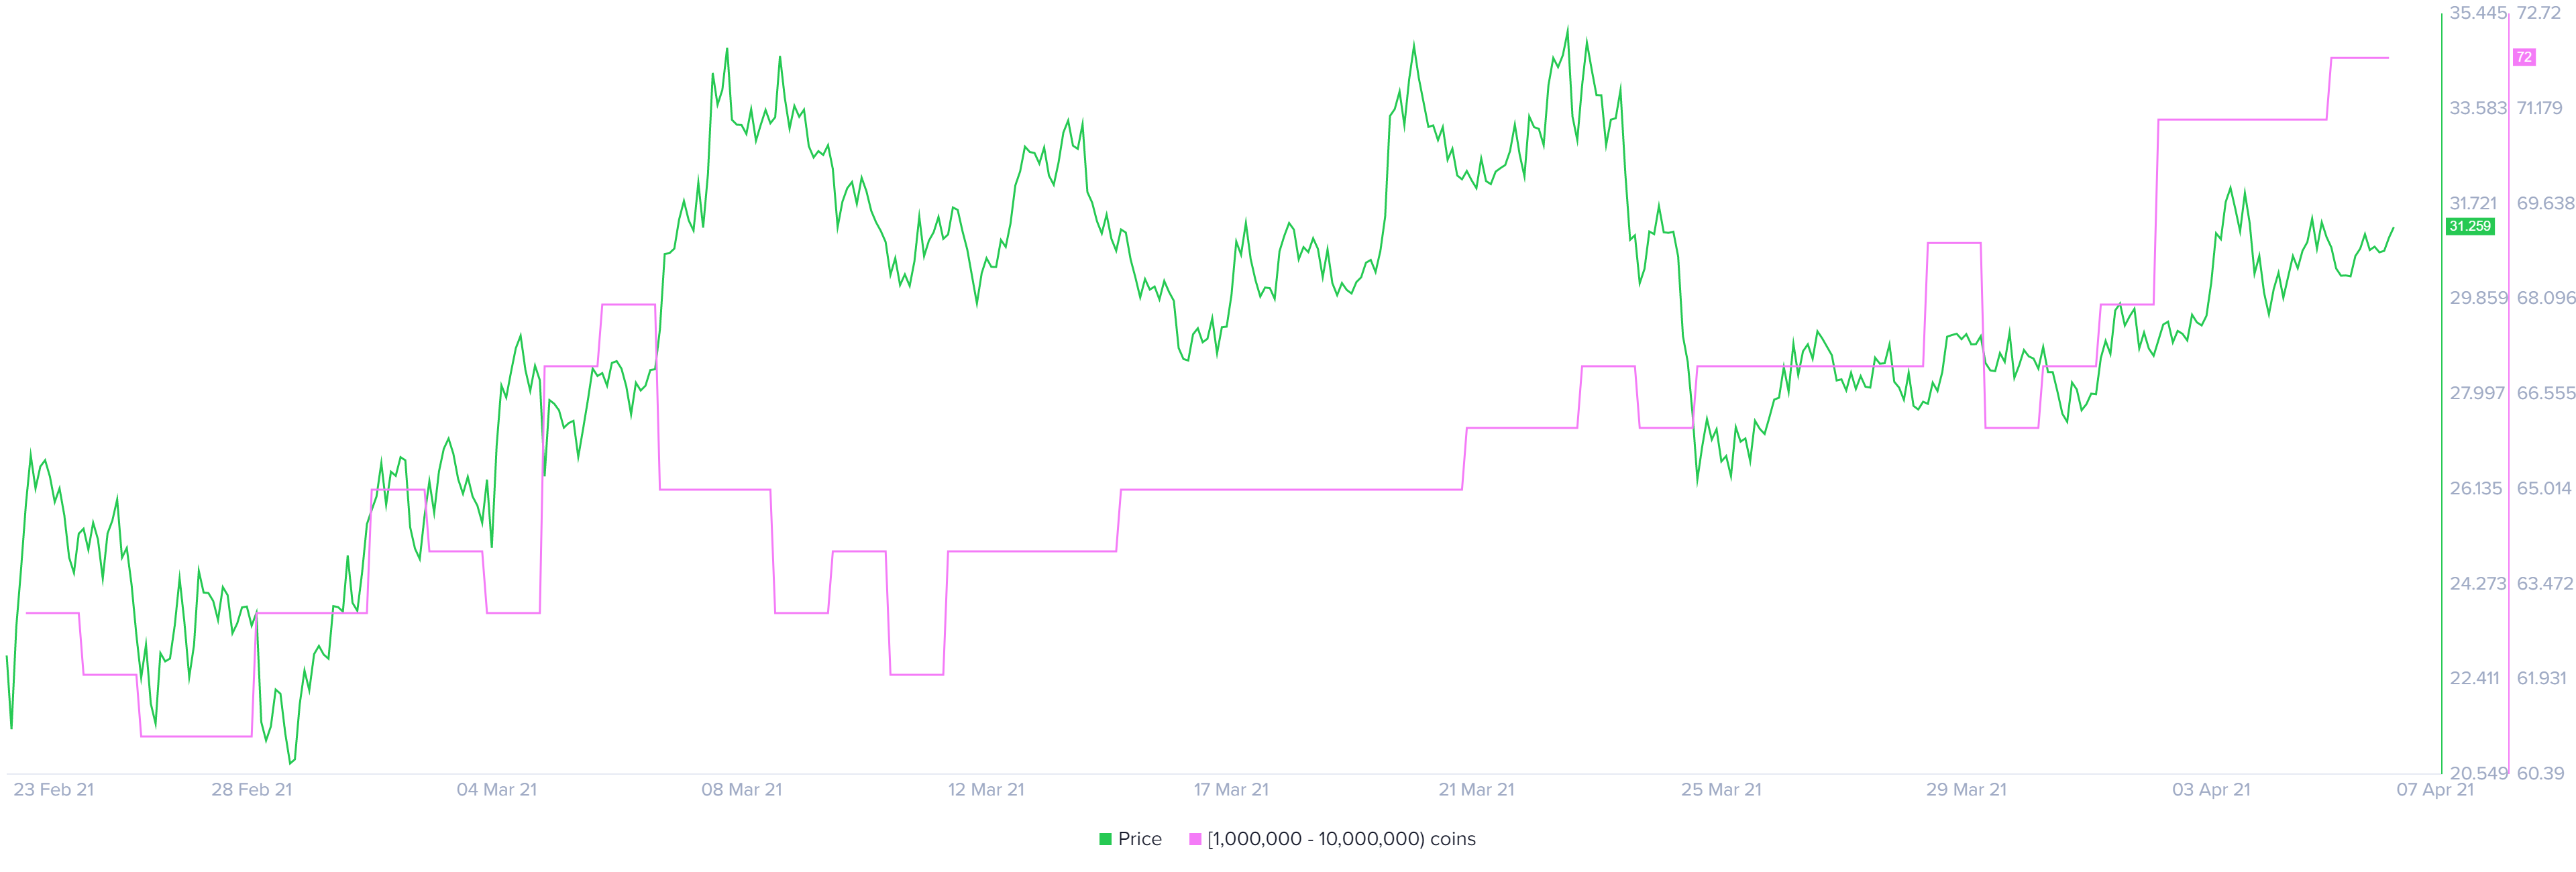
The whales holding 1,000,000 to 10,000,000 UNI tokens have been on an accumulation spree since March 11. A total of 10 new high net worth investors have joined this category, further reinforcing the bullish outlook surrounding the Uniswap price.
Uniswap whale holder distribution chart
Although the on-chain metrics point to a bullish narrative for the DeFi coin, the Uniswap price is not in the clear. A sell-off that slices through the 50 Simple Moving Average (SMA) at $30.26 and the 100 SMA at $28.29 on the twelve-hour chart will signal failing optimistic momentum.
However, a decisive close below $27.95 will invalidate the upward trajectory and catalyze a new downtrend. In such a scenario, the Uniswap price might drop 21% to the demand barrier at $22.06.
Author

Akash Girimath
FXStreet
Akash Girimath is a Mechanical Engineer interested in the chaos of the financial markets. Trying to make sense of this convoluted yet fascinating space, he switched his engineering job to become a crypto reporter and analyst.



