Uniswap Price Projection: UNI is set to decline 35%
- Uniswap price locked between two daily moving averages.
- Ascending wedge breakdown is a warning sign for traders.
- Daily volume totals show weak commitment off the March low.

Uniswap price printed an all-time high, reversed, and closed below the ascending wedge formation on March 23, triggering a 12% decline on March 24. UNI has discovered support at the 50-day simple moving average (SMA), but well below average volume undermines the bounce’s credibility.
Uniswap price not experiencing Bitcoin’s magnet effect
The BTC rebound’s magnet effect has not transferred to UNI over the last four trading days like other altcoins. UNI lacks the impulsive price action that confirms a meaningful price low, and it presently hovers below the 21-day SMA, a moving average the coin held since the end of December.
A break below the 50-day SMA on a daily close will indicate that UNI is vulnerable to test the 100-day SMA at $18.33. However, before that can happen, it needs to fracture the 0.382 Fibonacci retracement level at $23.46 and the 0.50 retracement level at $19.33. It is a price range supported by the price congestion in early February.
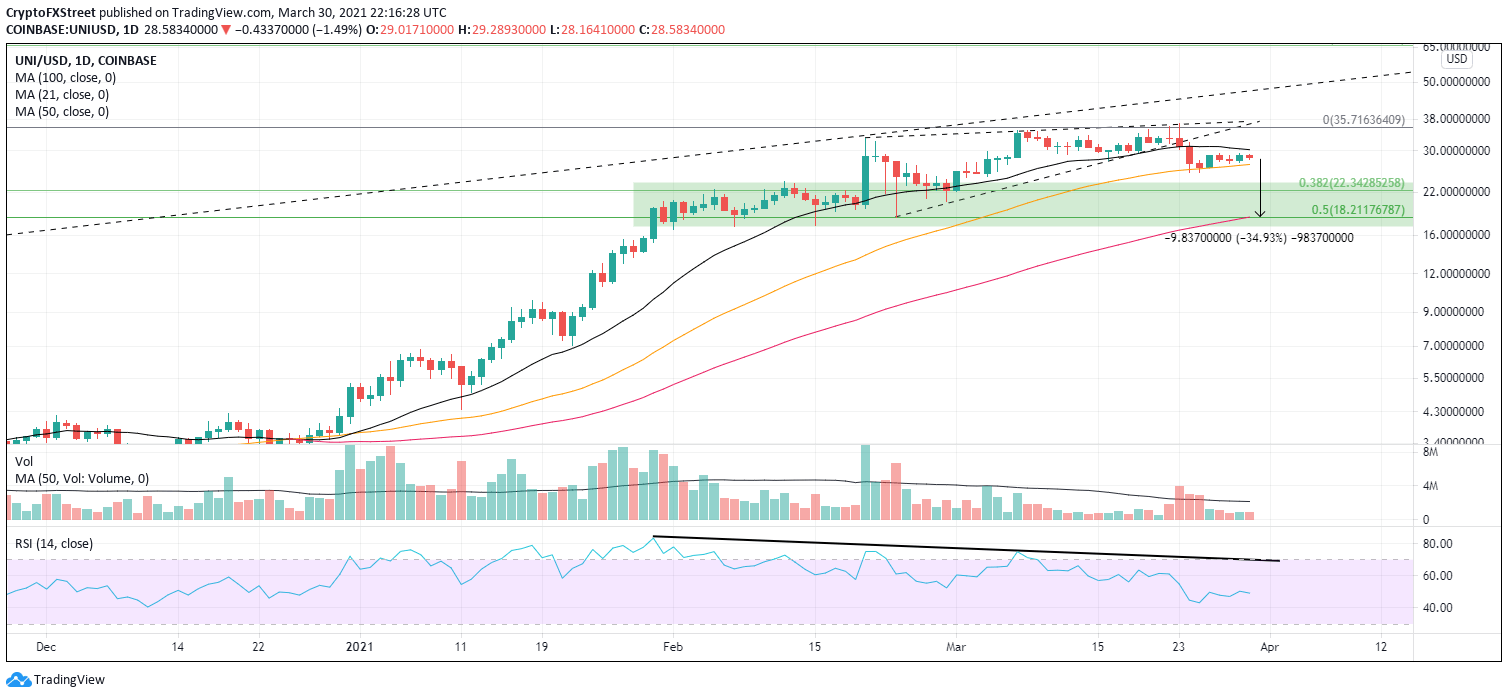
UNI/USD daily chart
Of course, BTC strength’s magnet effect could finally grab UNI and lift it higher, but it first needs to overcome the 21-day SMA at $30.26. The next resistance level is the March 23 high at $36.83, where traders need to wait for a daily close over that price before chasing new trades.
Bulls could become lucky and find a runway to the topside trendline at the September 2020 high through the February 2021 high at $46.70.
Author

Sheldon McIntyre, CMT
Independent Analyst
Sheldon has 24 years of investment experience holding various positions in companies based in the United States and Chile. His core competencies include BRIC and G-10 equity markets, swing and position trading and technical analysis.


