Uniswap Price Analysis: UNI overwhelmed by selling pressure, targets $17.10
- Uniswap highest price on March 23 was the fake-out before the breakdown.
- Rising wedges break out to the downside 69% of the time.
- 3-day volume total the highest since the February crash.

Uniswap price has fallen below the lower trendline of an ascending wedge and quickly tested the 50-day simple moving average (SMA), yielding a 30% decline from the March 23 high. The prevailing negative tilt of the indicators projects that the selling should continue in the days ahead.
Uniswap price not attracting aggressive buyers
Ascending wedges can be a consolidation pattern with the trend, especially against an existing trend, or a topping pattern. Since the higher spike on February 20, UNI has been quietly molding an ascending wedge on declining volume, with intermittent highs not being confirmed by the Relative Strength Index (RSI).
To be fair to the bulls, it is important to mention that an ascending wedge pattern with a downward breakout is one of the least reliable patterns in the trading encyclopedia.
Nevertheless, the magnitude of the UNI reversal and the surge in volume cannot be overlooked or minimized. Yes, the 3-day volume total is the highest since the February crash, but the current 3-day percentage decline is set to be the largest since January.
The 50-day SMA has halted the sell-off over the last two days, but unless persuasive support can materialize, the projection is for a more profound decline.
Look to the 0.382 Fibonacci retracement level at $23.46 to provide some support. Still, meaningful support begins at the 0.50 retracement level at $19.33. This continues down to the February lows intersection with the 100-day SMA at $17.10, producing a loss of 35% from current levels.
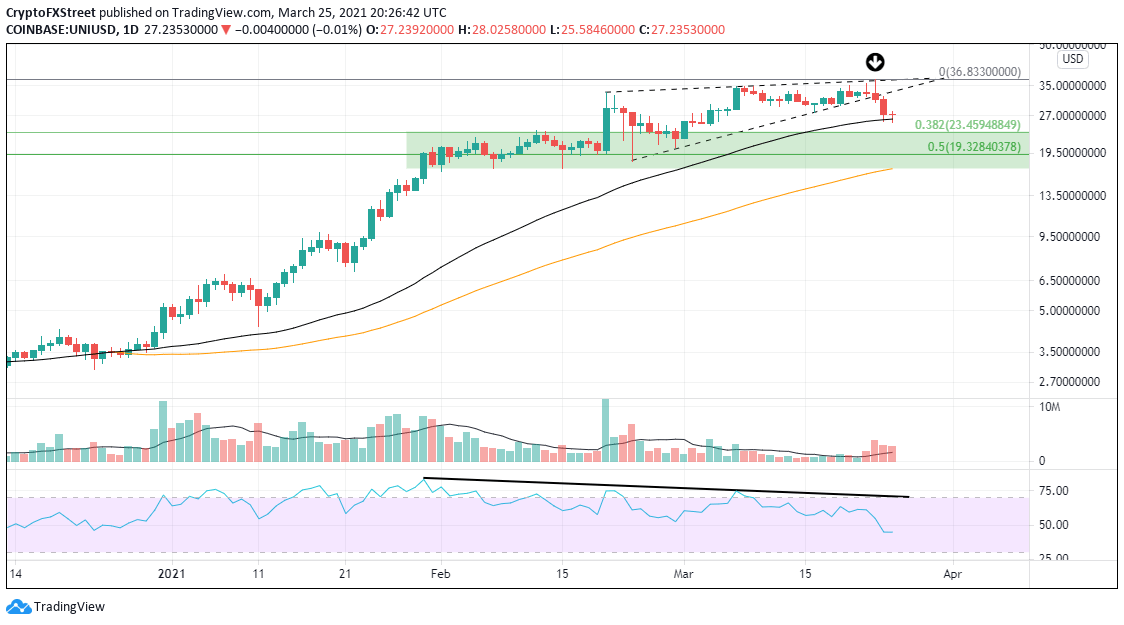
UNI/USD daily chart
Naturally, a short-term oversold bounce could unfold, but UNI would need to close above the broken trendline on a daily basis before beginning to entertain potential upside targets.
For now, the 50-day SMA is a reasonable risk level for day traders to go long and capture profits from a minor bounce.
Author

Sheldon McIntyre, CMT
Independent Analyst
Sheldon has 24 years of investment experience holding various positions in companies based in the United States and Chile. His core competencies include BRIC and G-10 equity markets, swing and position trading and technical analysis.



