Uniswap price could crash 12% as investors take profits
- Uniswap price is getting rejected by the bearish order block extending from $11.80 to $11.35.
- On-chain data suggests UNI investors are booking profits, increasing the selling pressure on the token.
- If the daily candlestick closes above $11.82, the bearish thesis would be invalidated.

Uniswap (UNI) price looks set to fall in the short term, dragged by a wave of profit-taking from investors after the 46% rally seen last week.
Uniswap price likely to correct
Uniswap price is currently facing rejection from the order block from April 8, which extends from $11.35 to $11.80. An order block is an area where market participants, such as institutional traders, have placed large sell orders.
Furthermore, UNI price has been unable to decisively break above the $11.48 level, which aligns with the Fibonacci 50% retracement level measured from its swing high of $17.06 on March 6 to its swing low of $5.90 on April 13.
The Relative Strength Index (RSI) on the daily chart is at 73.3, above the overbought threshold of 70. A high RSI value indicates that an asset is overbought, and the price could fall. If the RSI exits this overbought area, it could be a signal to sell UNI tokens.
If UNI token is rejected from order block $11.35 to $11.80 or Fibonacci 50% level of $11.48, it could decline 12% from its present price of $11.20 to $9.66, which is the daily support level on May 22.
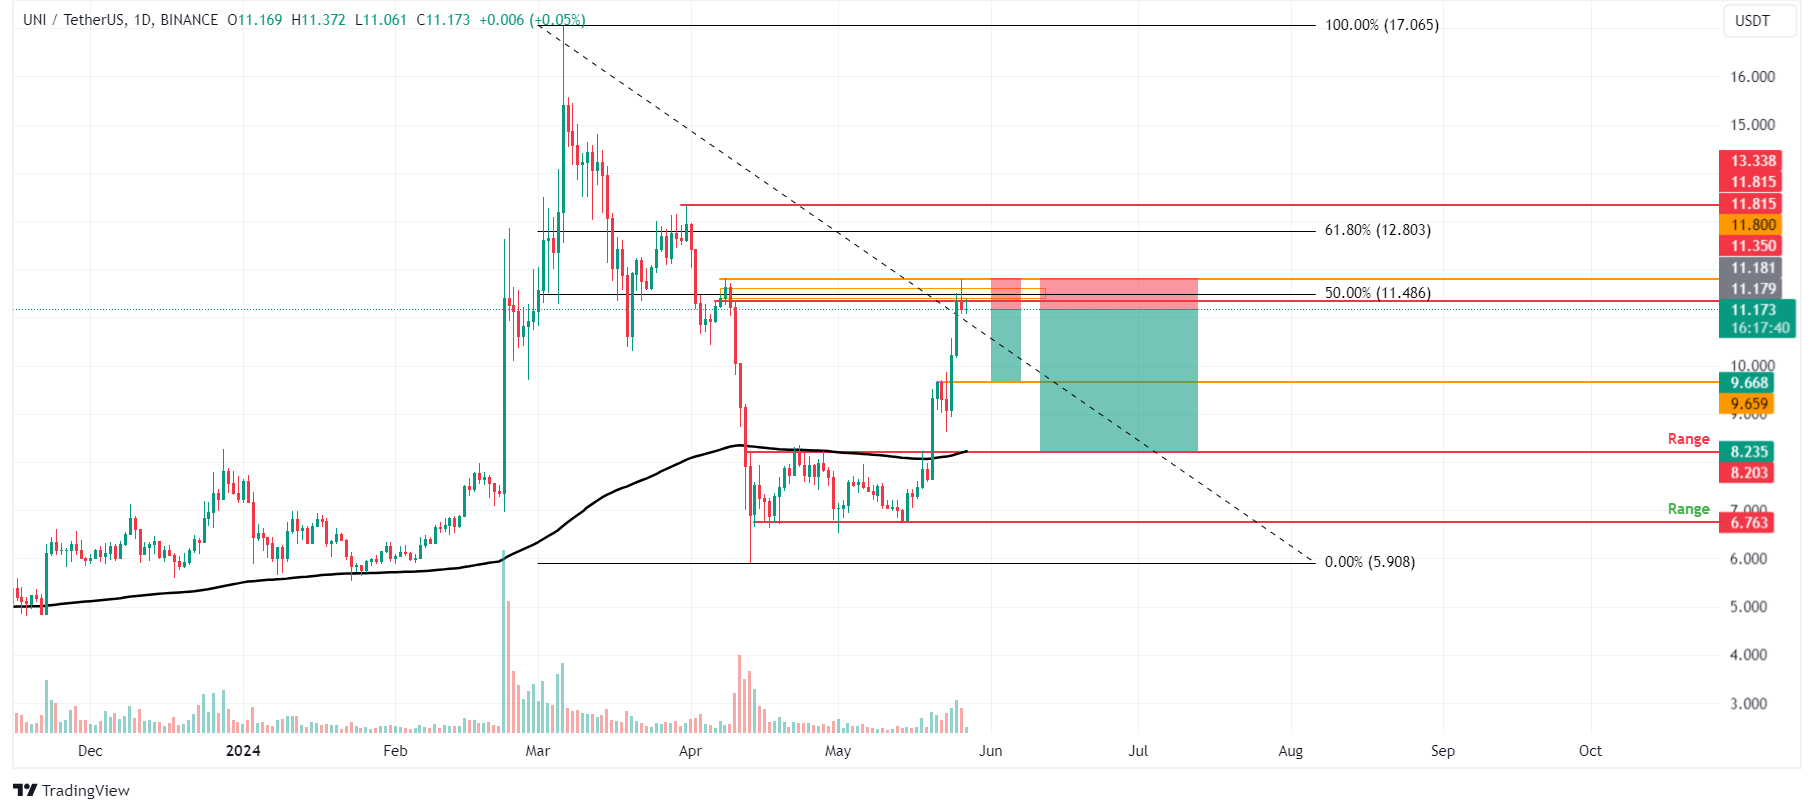
UNI/USDT 1-day chart
Santiment’s statistics on UNI's 30-day Market Value to Realized Value (MVRV) lend validity to the gloomy view of Uniswap pricing. This on-chain indicator calculates the average profit or loss of investors who acquired UNI within the last month.
Based on UNI's history, the trend reversal often occurs when the 30-day MVRV is between +35% and +38%. As shown in the figure, as of March 6, the 30-day MVRV was +35.66%, indicating that 35.66% of investors who purchased the tokens in the previous month are profiting. Booking those winnings resulted in a 40% price correction to $10.26.
Currently, the 30-day MVRV for UNI hovers around 25% after dropping from 35.88% on Saturday. This value indicates that investors who purchased UNI in the previous month are at an average profit of 25%. Booking those winnings may result in a price drop for UNI tokens.
%20[11.19.23,%2027%20May,%202024]-638523946488674270.png)
UNI 30-day MVRV ratio chart
Looking up, if the UNI daily candlestick price closes above the $11.82 high, then it would form a higher high, invalidating the bearish thesis. In that case, UNI could rally 13% to retest its daily high of $13.33 from March 31.
Author

Manish Chhetri
FXStreet
Manish Chhetri is a crypto specialist with over four years of experience in the cryptocurrency industry.


