Dogwifhat crashes 60%, but here's why you should not buy WIF yet
- Dogwifhat price shows signs of potential rangebound movement.
- Traders can start a short-term trade plan trading this range.
- Long-term investors should consider buying WIF between $1.95 to $1.50 levels.

Dogwifhat (WIF) price shows a slowdown in the bearish momentum as it sets up a potential range. This development could lead to a good buying opportunity from a long-term perspective.
Also read: Dogecoin on-chain metrics signal DOGE could suffer price drop
Dogwifhat price and short-term trading approaching
Dogwifhat price has shed 60% from its all-time high of $4.85 and currently trades at $2.60. After a historic rally that propelled WIF by 1,587% in just seven weeks, it is natural for the meme coin to slide lower.
On the twelve-hour chart, Dogwifhat price could consolidate between $1.95 to $3.26 levels. This consolidation could be a key accumulation level for long-term buyers. Ideally, a sweep of the range low of $1.95 is likely before WIF bottoms out and triggers a reversal.
From a short-term perspective, playing the range would be the best way to go. A sweep of $1.95 followed by a potential run-up to the range’s midpoint at roughly $2.54 or the range high at $3.26. But from a long-term perspective, the scenario is different.
Also read: Meme coins experience a price correction as BOME, WIF, PEPE, and FLOKI fall
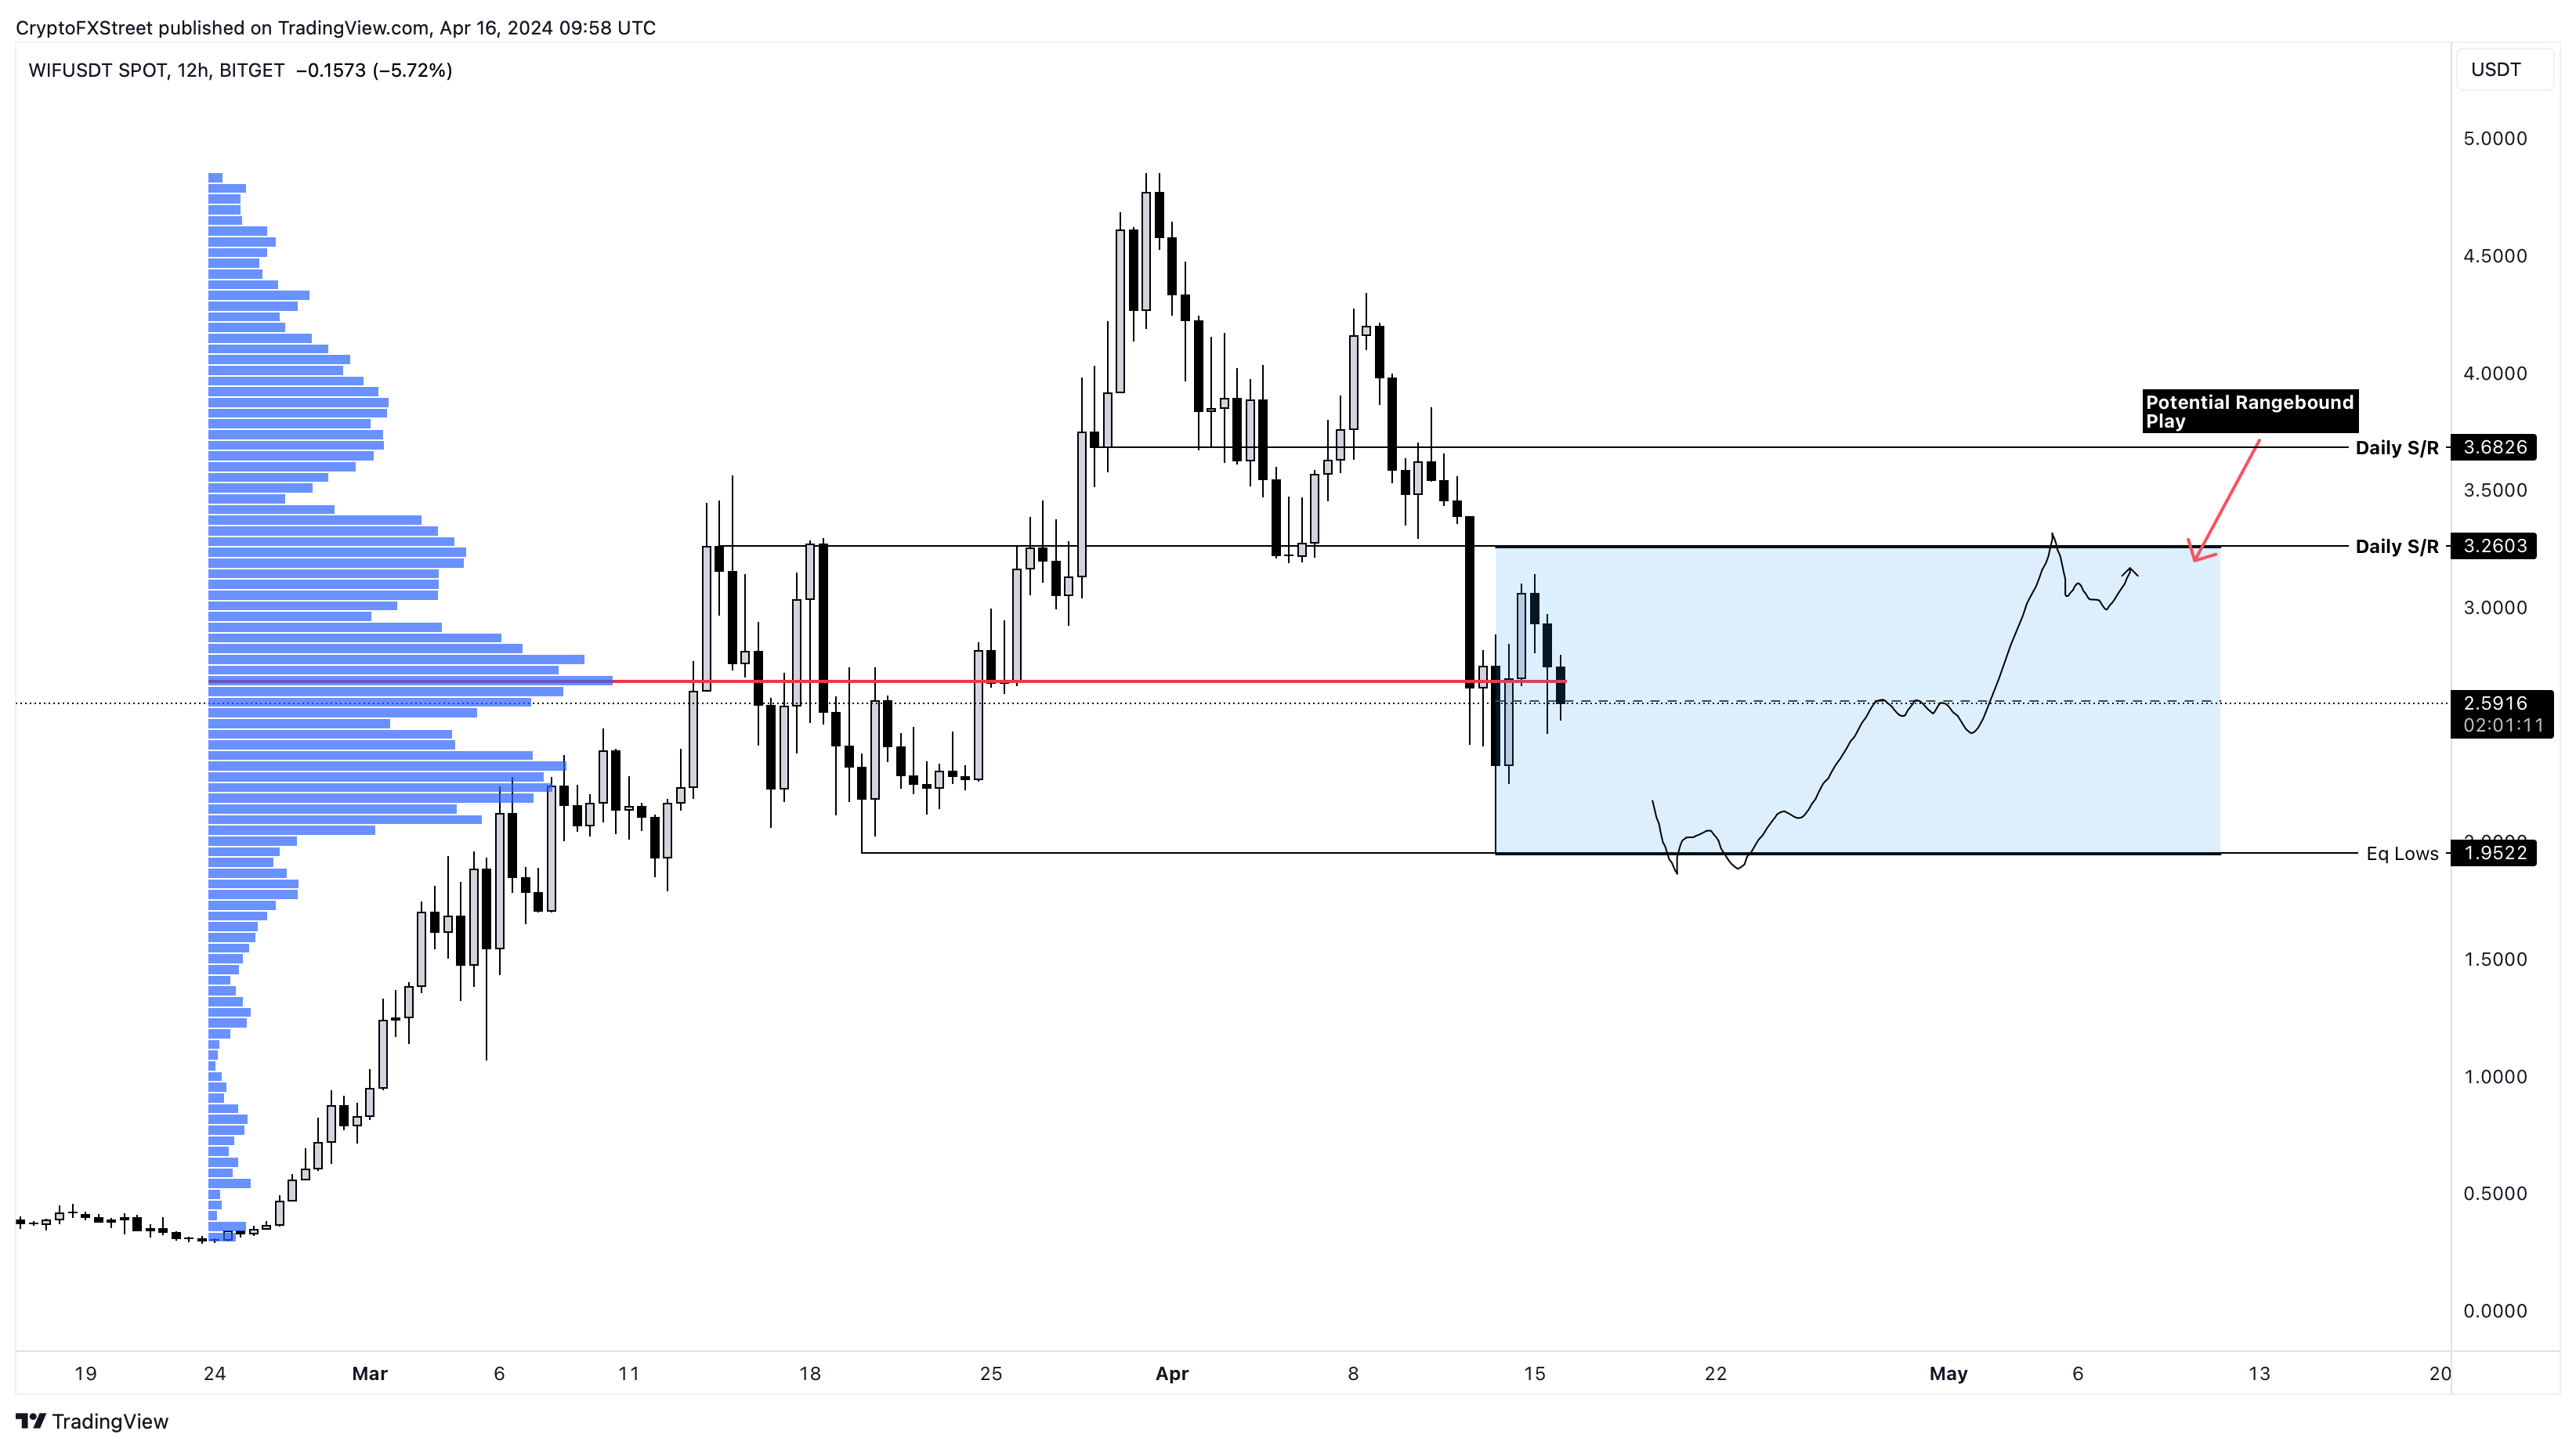
WIF/USDT 12-hour chart
Long-term game plan for WIF buyers
For those investors that are willing to play the long game, the range appears to be a great place to buy. Ideally, rangebound movement and bottom reversal patterns have a few characteristics.
Rarely do altcoins just form a bottom and kick-start a rally.
Typically, a manipulation move occurs that pushes the altcoin below this consolidation range.
As long-term investors, the approach should be to buy the liquidations or weakness, i.e., buy when short-term holders are capitulating. Therefore, from a long-term perspective, dollar-cost averaging between $1.95 to $1.50 would be ideal.
Furthermore, placing stink bids below $1.50 would be a good approach, especially if the crypto markets undergo a volatile crash as seen in March 2020.
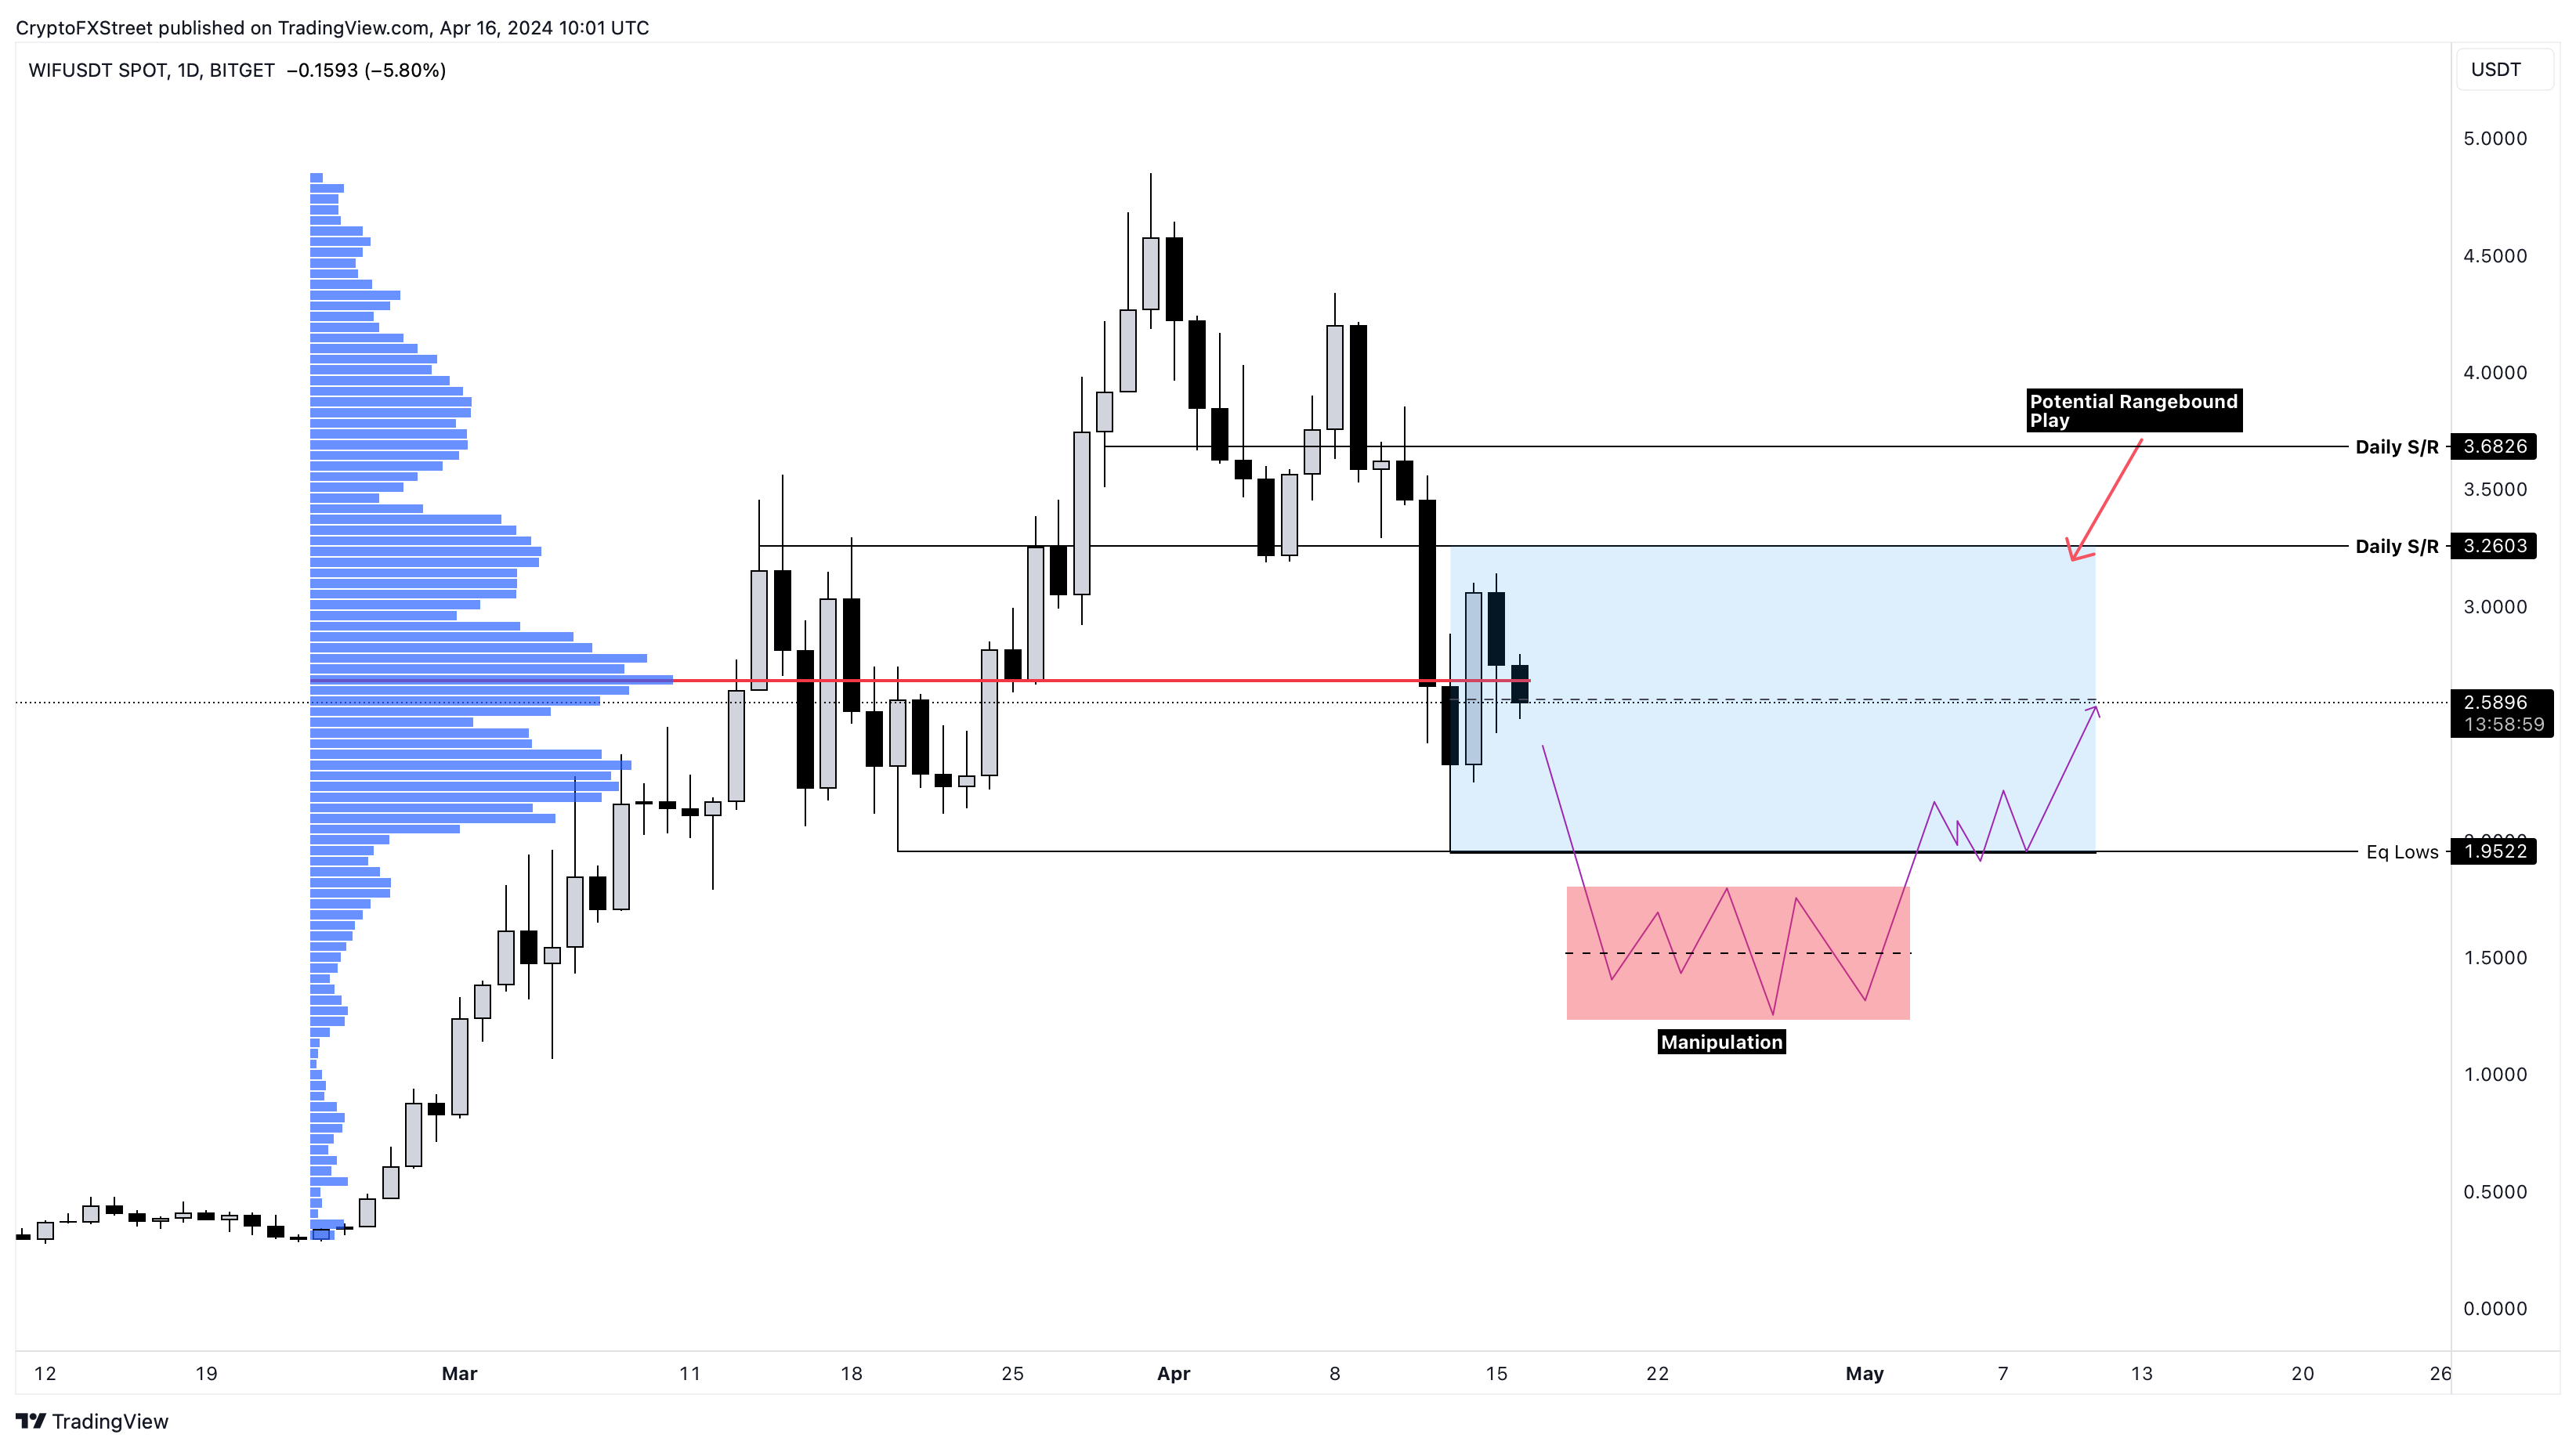
WIF/USDT 3-day chart
The above Dogwifhat price analysis assumes that Bitcoin price will resume the bull run after the fourth halving event as it has happened during the previous ones. BTC has triggered a massive rally a year after the halving upgrade. So, if this trend continues, altcoins, including Dogwifhat, could appreciate much more, yielding handsome returns.
On the other hand, if Bitcoin continues to bleed, this accumulation idea would be invalidated.
Also read: WIF price rallies 60% as Dogwifhat’s photo sells as NFT for $4.3 million
Author

Akash Girimath
FXStreet
Akash Girimath is a Mechanical Engineer interested in the chaos of the financial markets. Trying to make sense of this convoluted yet fascinating space, he switched his engineering job to become a crypto reporter and analyst.




