Uniswap Price Forecast: UNI could be poised for 30% rally after month-long lull
- Uniswap price breaks out of the 35-day consolidation price zone, signaling a potential upward move.
- On-chain data shows tokens from dormant wallets are moving again.
- A daily candlestick close below $6.76 invalidates the bullish thesis.

Uniswap (UNI) price has broken out of a 35-day consolidation this week, a sign of a possible rally ahead that could increase the token’s price around 30%. Technical indicators support the bullish thesis, while on-chain data also aligns with it.
Uniswap price looks set to reclaim highs
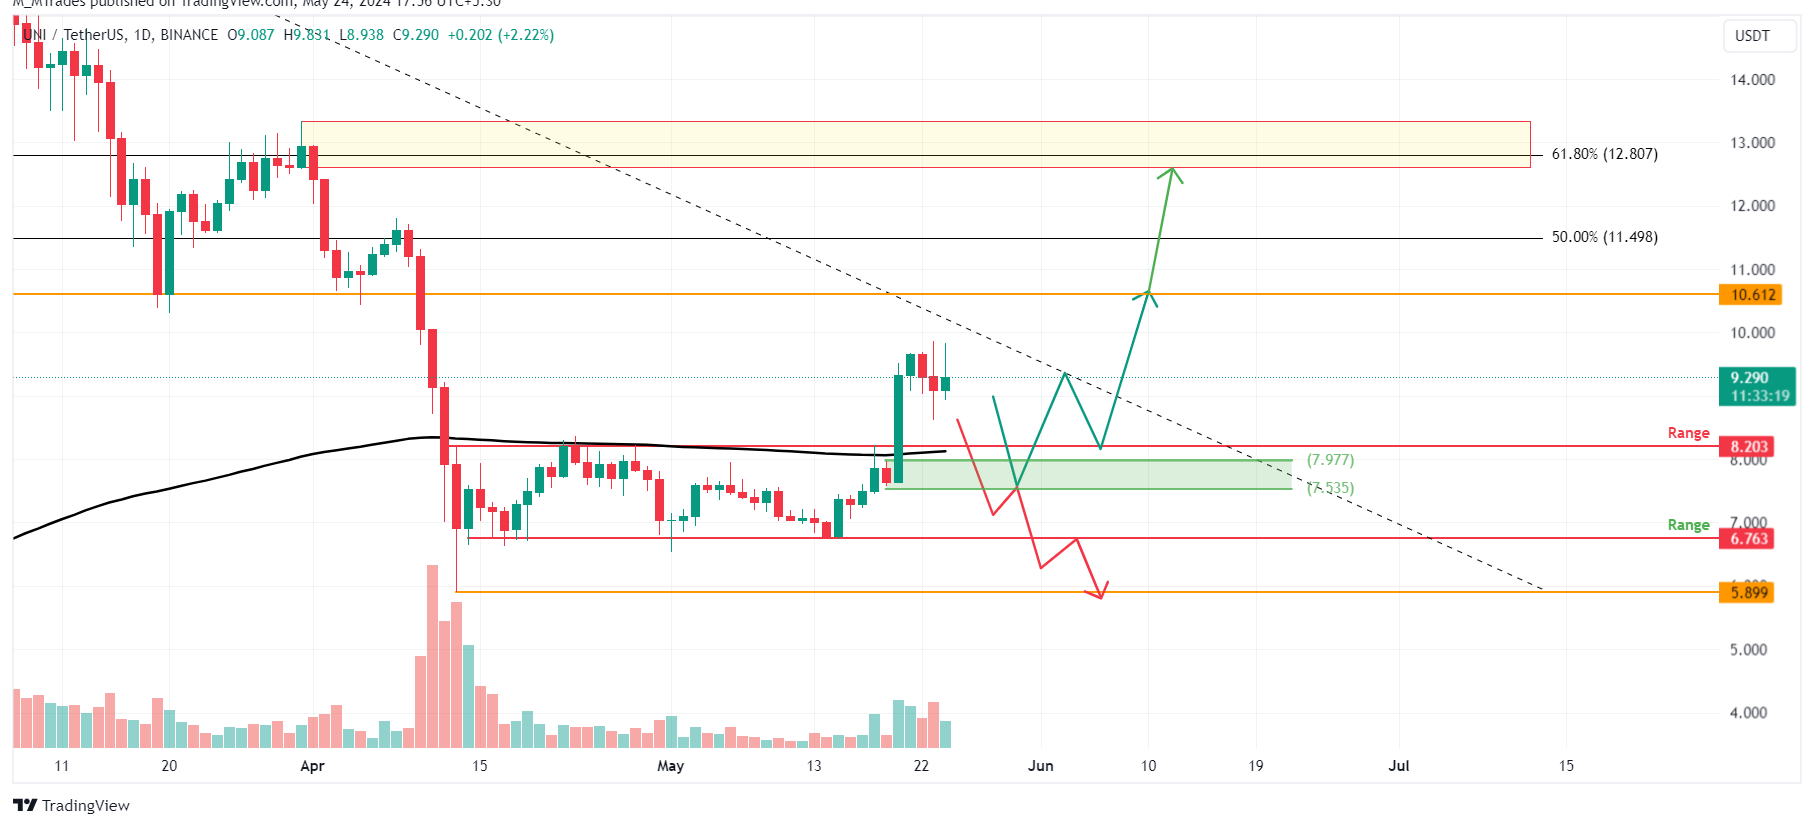
Uniswap price broke the $6.76 to $8.20 consolidation after a 20% rally on May 22. This move also allowed UNI to establish itself above the 200-day Exponential Moving Average (EMA), currently hovering at $8.07. Typically, massive moves tend to revert to the mean, which provides an opportunity for sidelined buyers to accumulate.
There are three levels to buy UNI dip.
- A retest of the 200-day EMA at $8.07, roughly 13% lower than the current price of $9.40.
- The daily order block, extending from $7.53 to $7.97, coincides with the 200-day EMA and is the second level to buy UNI.
- Investors can also consider securing UNI if it retests the upper limit of the aforementioned range at $8.20.
Assuming Uniswap price bounces from the $8.20 level, the conservative target is $10.61, which is roughly 30% away. Beyond this, UNI could also retest $12.80 in case of an extremely bullish outlook. This move would constitute a 60% gain. The second target is ambitious and is only likely to occur if the market condition is extremely bullish.
Supporting this bullish thesis, the Relative Strength Index (RSI) and the Awesome Oscillator (AO), both of which, have breached their mean levels of 50 and 0, indicating that the bulls are in control.
UNI/USDT 1-day chart
Santiment’s Age Consumed index is in line with the bullish outlook noted from a technical perspective. The spikes in this index suggest dormant tokens (tokens stored in wallets for a long time) are in motion and can be used to spot short-term local tops or bottoms.
For UNI, history shows that the spikes were followed by a rally in Uniswap price. The most recent uptick on April 25 also forecasted that UNI was ready for an uptrend.
%20[14.20.56,%2024%20May,%202024]-638521498940018919.png)
UNI Age Consumed chart
Regardless of promising technical analysis and on-chain data, if the daily candlestick closes below the $6.76 price level, a lower low would be formed. This scenario would flip the bullish market structure to bearish, which could cause the UNI price to crash 13% to $5.89.
Author

Manish Chhetri
FXStreet
Manish Chhetri is a crypto specialist with over four years of experience in the cryptocurrency industry.


