UMA Price Prediction: UMA explodes 65% within four hours for no apparent reason
- UMA is up 65% within the past four hours, with a huge spike in trading volume.
- The digital asset has seen a massive 125% growth in the past two days towards $13.5.
UMA is currently trading at $10.23 but touched $13.19 earlier after a tremendous price spike accompanied by a lot of trading volume.
UMA/USDT 12-hour chart
-637378679652036405.png)
It seems that UMA is getting rejected from the 50-SMA on the 12-hour chart after climbing above it briefly. This recent spike has allowed the price to smash through several resistance levels and turn the MACD heavily bullish.
UMA/USDT 4-hour chart
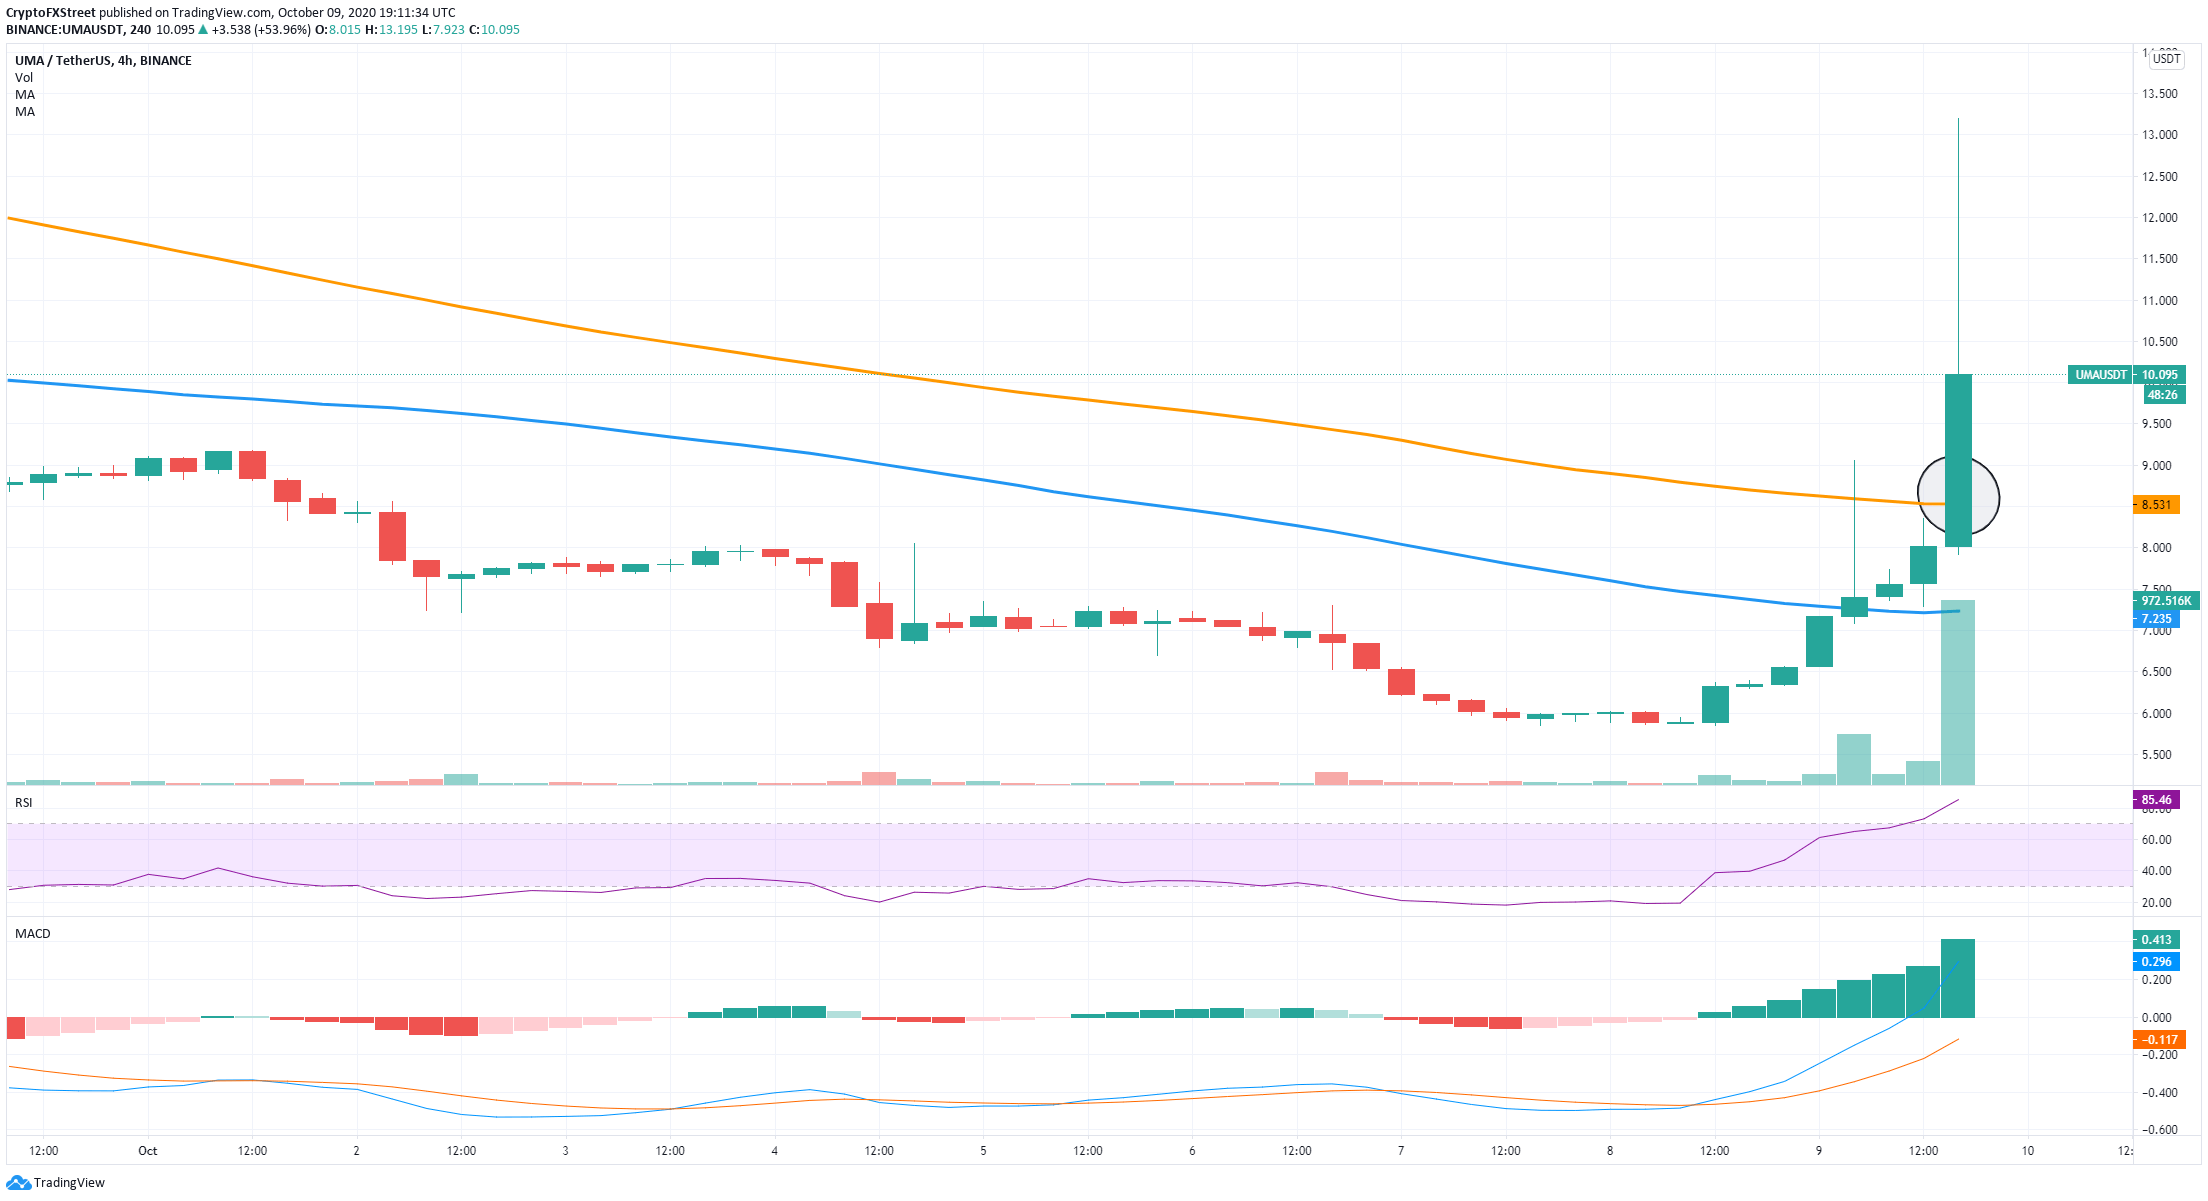
The TD sequential indicator presented a buy signal on the 4-hour chart on October 7. The RSI was in oversold territory for several days, and it seems that finally the signal was validated on October 8 with massive follow through.
The price has climbed above the 50-SMA, turning it into support and also the 100-SMA, although it hasn’t closed above it just yet. If the bulls can hold the 100-SMA as support, we could see another re-test of the high at $13.19 in the short-term.
UMA IOMAP Chart
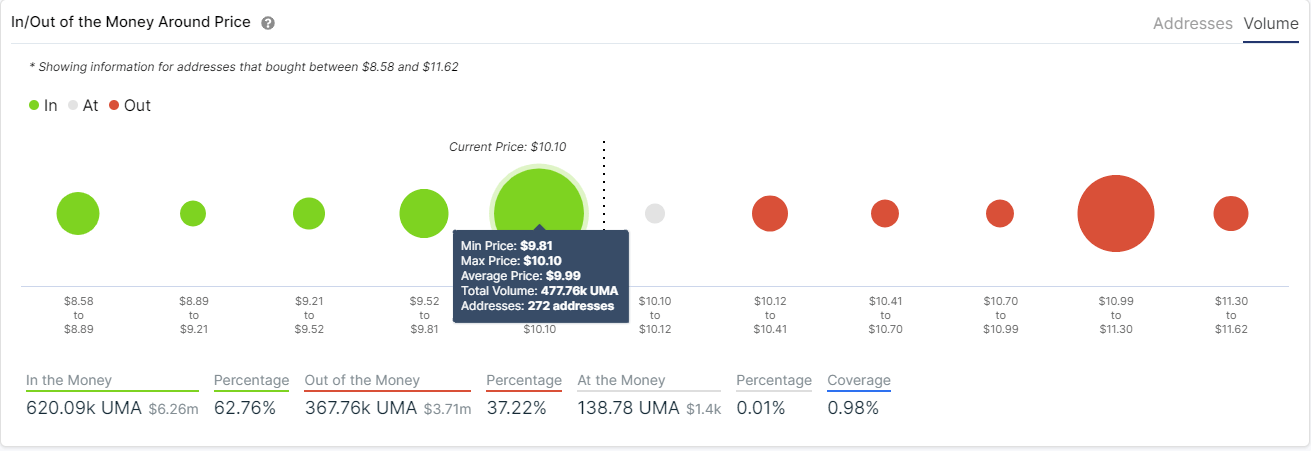
The In/Out of the Money Around Price chart by IntoTheBlock shows a strong support area between $9.81 and $10.10, but almost no resistance until $11. The $10.99-11.30 area has a total volume of 312,000 UMA coins compared to the support area with 477,000 in volume.
On the other hand, there is also almost no support below the most crucial area between $9.81 and $10.10. At the same time, on the 4-hour chart, the TD sequential indicator is on the verge of presenting a sell signal.
A bearish breakout below $10 has the potential to drop UMA down to $8.5, where the 100-SMA currently stands. The next target price would be $7.23, the 50-SMA.
Bulls need to pay attention to the 100-SMA. If it holds, a re-test of $13.19 is definitely in the cards.
Author

Lorenzo Stroe
Independent Analyst
Lorenzo is an experienced Technical Analyst and Content Writer who has been working in the cryptocurrency industry since 2012. He also has a passion for trading.


