Tron price primed for a surge after breaking descending trendline barrier
- Tron price breaks above and retests the descending trendline, signaling a bullish market structure.
- On-chain data shows that TRX active accounts activity is rising, signaling greater blockchain usage.
- A daily candlestick close below $0.112 would invalidate the bullish thesis.

Tron (TRX) price has surged above and retested the descending trendline, indicating a bullish market structure. On-chain data reveals increasing activity among TRX active accounts, suggesting heightened blockchain usage that may fuel an impending rally in Tron’s price.
Tron price looks promising
Tron's price broke above the descending trendline on Saturday and retested it as support on Monday. This trendline is drawn by joining multiple swing high levels from the end of February to mid-June. At the time of writing, TRX is trading at $0.119, above the daily support level of $0.118.
If this support holds, TRX could rally 7% to retest $0.127, which is high on May 11.
On a daily chart, the Relative Strength Index (RSI) and the Awesome Oscillator (AO) support the bullish thesis by being above their respective mean levels of 50 and zero. These momentum indicators strongly indicate bullish dominance.
If TRX closes above $0.129, a 61.8% Fibonacci retracement level drawn from a swing high in February to a swing low in April, then it could extend an additional rally of 12% to retest the $0.144 high of February 27.
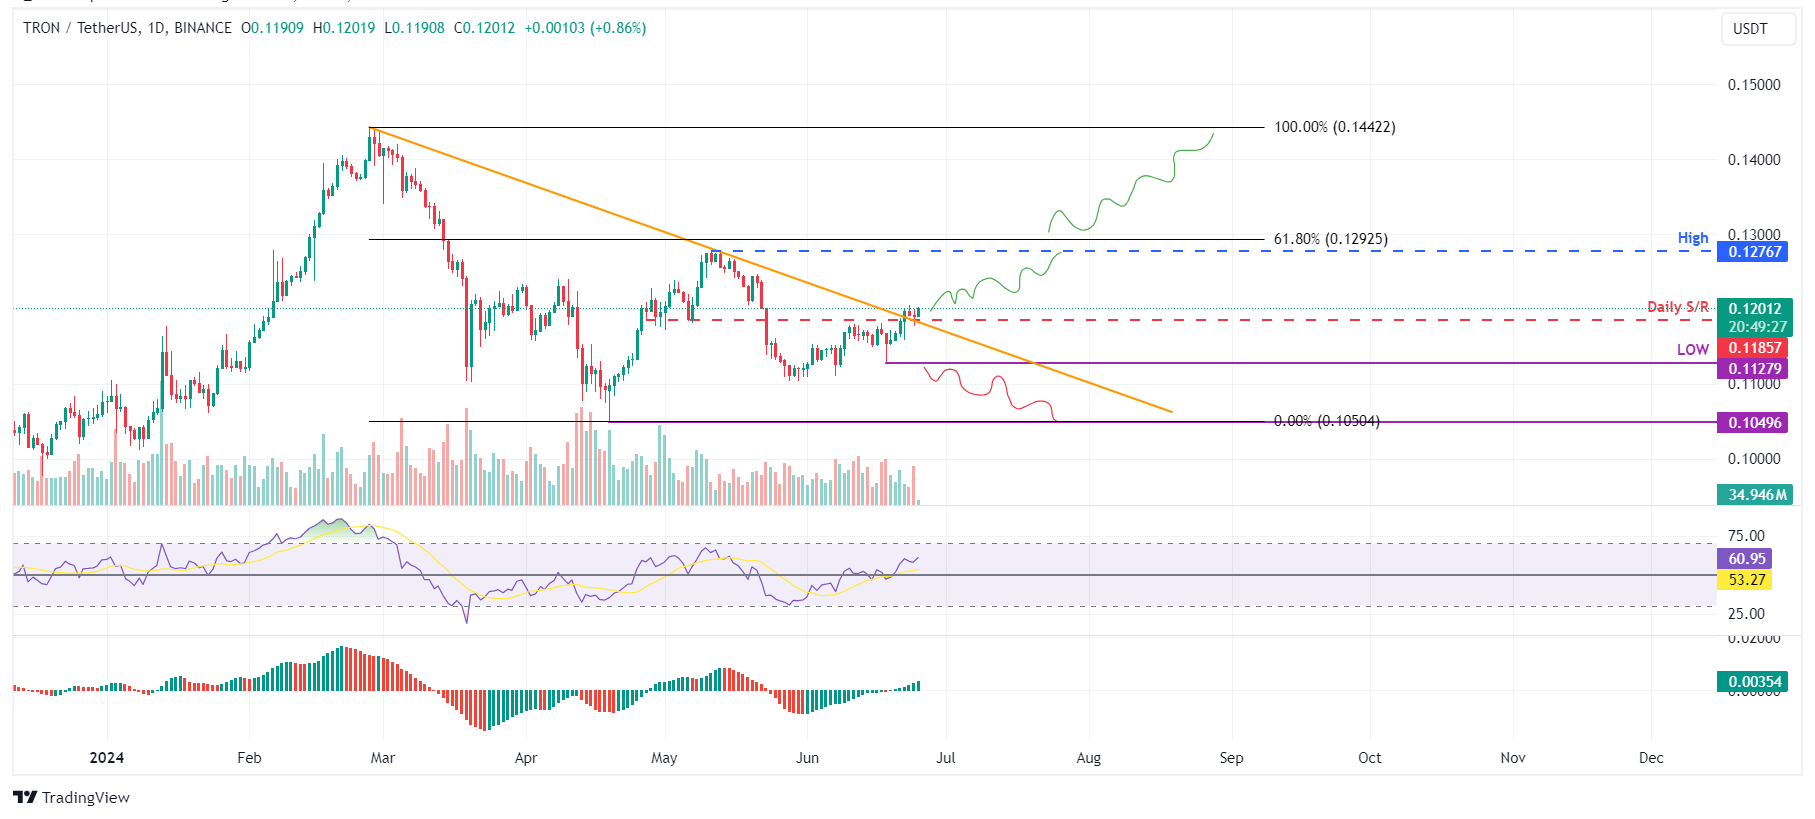
TRX/USDT 1-day chart
Data from the TRONSCAN Daily Active Accounts chart shows the number of TRON accounts, including wallet and contract accounts, that had transfer records during the specified period. The rise in the metric signals greater blockchain usage, while declining addresses point to lower demand for the network.
In Tron’s case, the daily active accounts on TRON have been 2.56m in the past month.
In the last month, daily active accounts on TRON have increased by 14.43%. This rise indicates that demand for TRX’s network is growing, which could rally Tron's price.
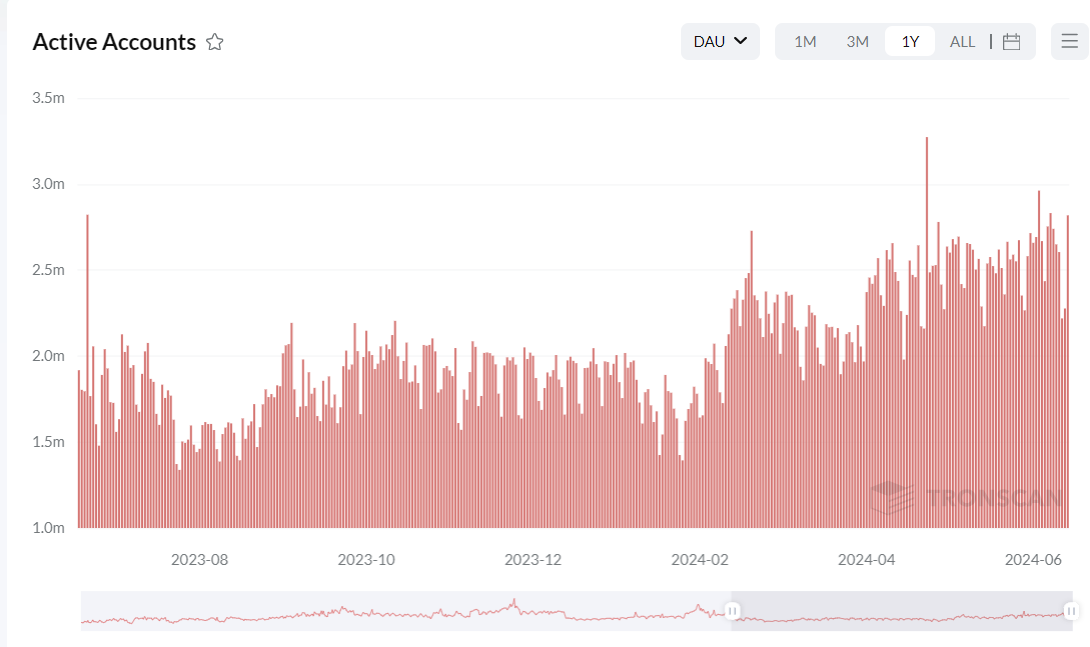
Tron Daily Active Accounts chart
However, if TRX's daily candlestick closes below $0.112 and establishes a lower low on the daily timeframe, it may signal a shift in market dynamics that favors bearish sentiment. Such a change could invalidate the bullish outlook, leading to a 7% decline in Tron’s price to retest its previous support at $0.105.
Author

Manish Chhetri
FXStreet
Manish Chhetri is a crypto specialist with over four years of experience in the cryptocurrency industry.


