Tron Elliott Wave technical analysis [Video]
![Tron Elliott Wave technical analysis [Video]](https://editorial.fxstreet.com/images/Markets/Currencies/Cryptocurrencies/cryptocurrenciesusd.jpg)
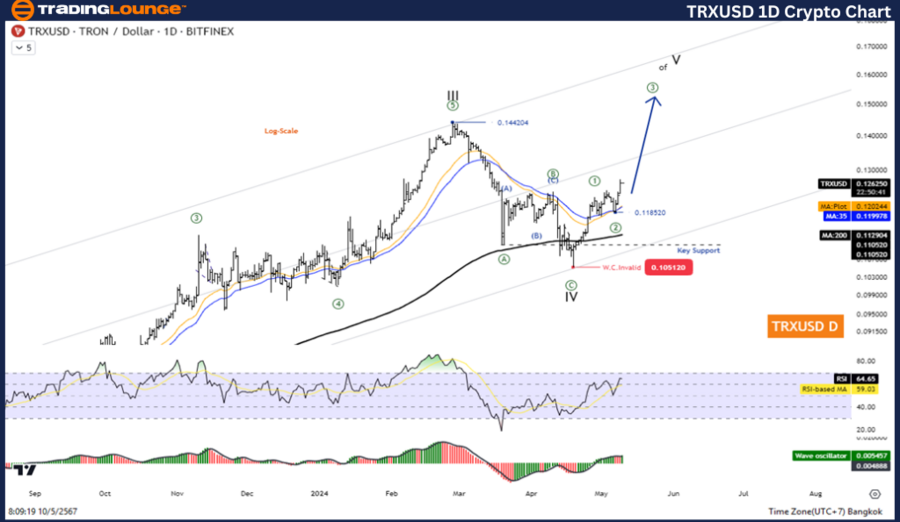
Elliott Wave Analysis TradingLounge Daily Chart,
Tron/ U.S. dollar(TRXUSD)
TRX/USD Elliott Wave technical analysis
Function: Follow trend.
Mode: Motive.
Structure: Impulse.
Position: Wave ((3)).
Direction next higher degrees: Wave V of Impulse.
Wave cancel invalid level: 0.1051.
Details: The five-wave increase of Wave ((3)).
TRON/U.S. dollar(TRXUSD)Trading Strategy:
The rise of the fifth wave in the Impulse pattern, which is subdivided into five waves. Currently, waves ((1)) and ((2)) are completed, the price is rising in wave ((3)). Therefore, the price There is a chance of continuing to increase above the level of 0.1442.
TRON/ U.S. dollar(TRXUSD)Technical Indicators: The price is above the MA200 indicating an Uptrend, The Wave Oscillator is a Bullish Momentum.
Elliott Wave Analysis TradingLounge H4 Chart,
Tron/ U.S. dollar(TRXUSD)
TRX/USD Elliott Wave technical analysis
Function: Follow trend.
Mode: Motive.
Structure: Impulse.
Position: Wave ((3)).
Direction next higher degrees: Wave V of Impulse.
Wave cancel invalid level: 0.1051.
Details: The five-wave increase of Wave ((3)).
TRON/U.S. dollar(TRXUSD)Trading Strategy:
The rise of the fifth wave in the Impulse pattern, which is subdivided into five waves. Currently, waves ((1)) and ((2)) are completed, the price is rising in wave ((3)). Therefore, the price There is a chance of continuing to increase above the level of 0.1442.
TRON/ U.S. dollar(TRXUSD)Technical Indicators: The price is above the MA200 indicating an Uptrend, The Wave Oscillator is a Bullish Momentum.

Technical analyst: Kittiampon Somboonsod.
TRX/USD Elliott Wave technical analysis [Video]
Author

Peter Mathers
TradingLounge
Peter Mathers started actively trading in 1982. He began his career at Hoei and Shoin, a Japanese futures trading company.


