TRON Elliott Wave technical analysis [Video]
![TRON Elliott Wave technical analysis [Video]](https://editorial.fxstreet.com/images/Markets/Currencies/Cryptocurrencies/Tokens/TRON/tron.jpg)
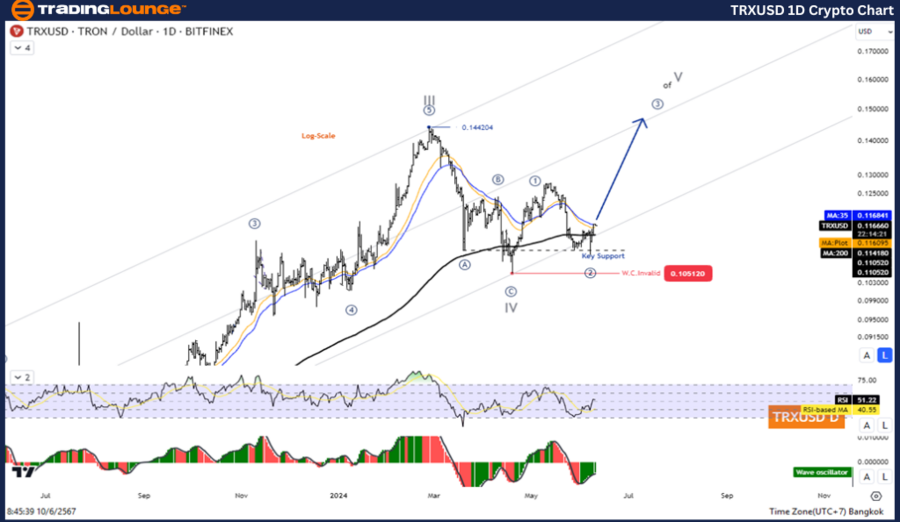
TRX/USD Elliott Wave technical analysis
Function: Follow trend.
Mode: Motive.
Structure: Impulse.
Position: Wave ((3)).
Direction next higher degrees: Wave V of impulse.
Wave cancel invalid level: 0.1051.
Details: The five-wave increase of wave ((3)).
TRX/USD trading strategy
A five-wave increase in the impulse pattern, with the second wave now appearing to be complete. And the price increased again during the third wave. The overall picture therefore increased again. Look for opportunities to join the upward trend from the correction.
TRX/USD technical indicators
The price is below the MA200 indicating an uptrend, the wave oscillator is a bullish momentum.
TRX/USD Elliott Wave technical analysis
Function: Follow trend.
Mode: Motive.
Structure: Impulse.
Position: Wave ((3)).
Direction next higher degrees: Wave V of impulse.
Wave cancel invalid level: 0.1051.
Details: The five-wave increase of wave ((3)).
TRX/USD trading strategy
A five-wave increase in the Impulse pattern, with the second wave now appearing to be complete. And the price increased again during the third wave. The overall picture therefore increased again. Look for opportunities to join the upward trend from the correction.
TRX/USD technical indicators
The price is below the MA200 indicating an uptrend, the wave oscillator is a bullish momentum.
.thumb-638535891686458297.png.a1fb54592e08698c864e818f7d65c475-638535891686458297.png)
TRX/USD Elliott Wave technical analysis [Video]
Author

Peter Mathers
TradingLounge
Peter Mathers started actively trading in 1982. He began his career at Hoei and Shoin, a Japanese futures trading company.


