Tron Price Prediction: TRX Whale demand surges 450% as Justin Sun reacts to Trump’s WLFI purchases
- Tron (TRX) price crossed $0.25 on Thursday, posited 13% gains since Trump’s inauguration.
- On Wednesday, Tron CEO Justin Sun alerted community followers to rapid TRX purchases by Trump-backed World Liberty Financial (WLFI).
- Since Monday, TRX whale transactions volume have increased by 450%, signalling that institutional investors mirrored Trump’s trades.

Tron (TRX) price crossed $0.25 on Thursday, posting 13% gains this week. On-chain data shows institutional traders have been buying an unusual amount TRX since Trump’s inauguration. Is TRX price on the verge of another leg up.
Tron price surges 13% as Justin Sun reacts to Trump’s WLFI purchases
Tron has seen significant gains this week, emerging as one of the leading beneficiaries of the bullish sentiment around Trump’s inauguration.
Tron’s connection to Trump’s presidency first surfaced in November 2024, when founder Justin Sun announced a $10 million investment in World Liberty Financial (WLFI), a cryptocurrency investment platform launched by Donald Trump’s family.
The connection resurfaced on Tuesday when on-chain transaction trackers reported WLFI acquiring substantial amounts of TRX.
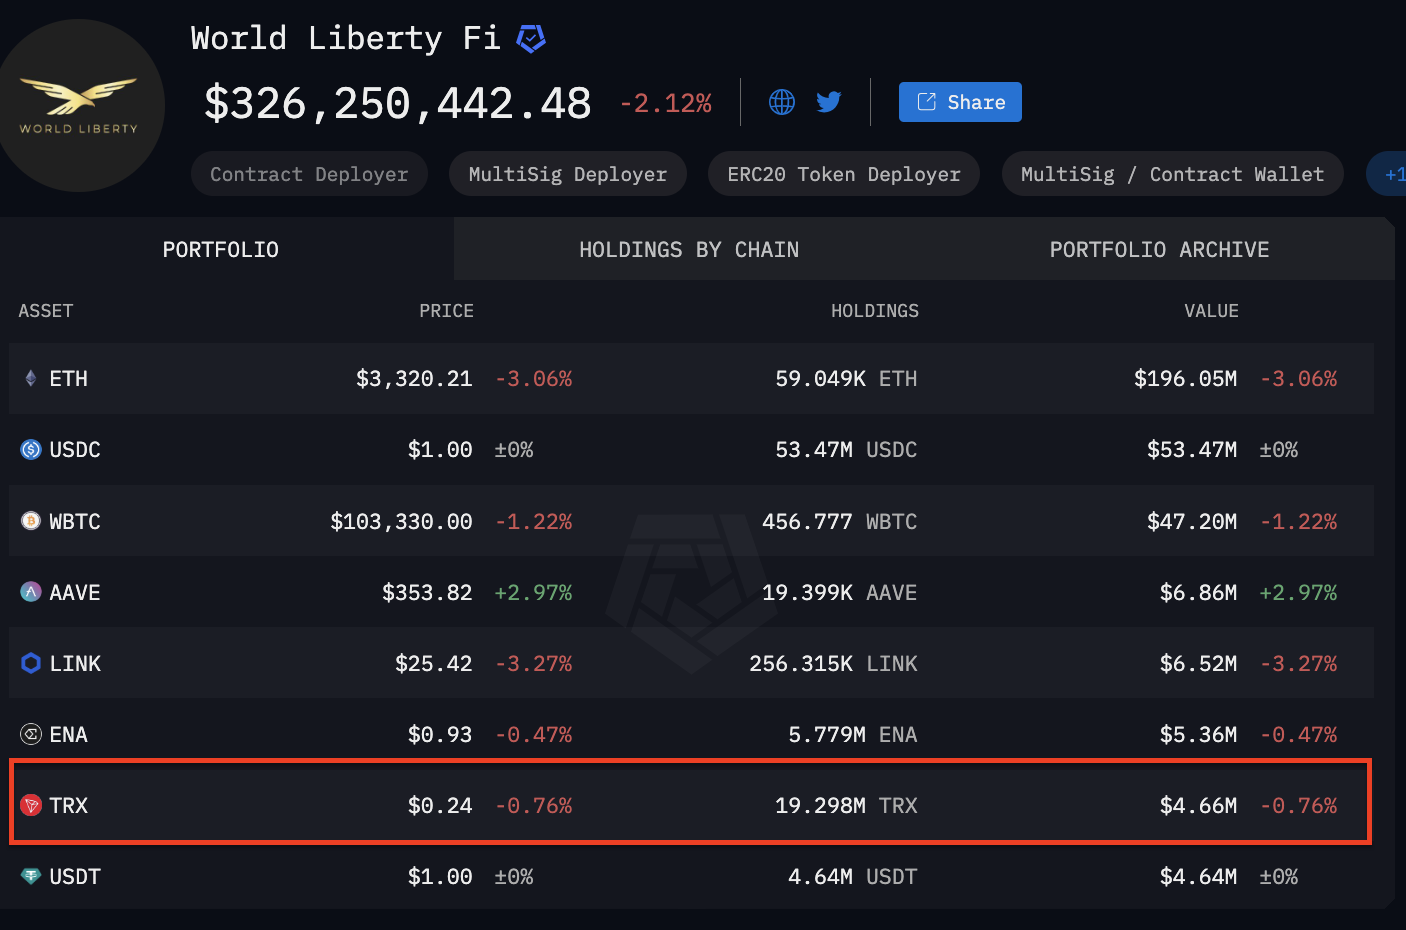
As of Thursday, data from Arkham Intelligence shows the Trump-backed firm has purchased 19.3 million TRX, worth $4.7 million.
Tron (TRX) Price Action
In response, TRON saw a strong surge in demand as Justin Sun began alerting the community to WLFI’s purchases.
According to the chart above, TRX has risen 13.6% since Trump’s inauguration, breaking above the $0.25 level at the time of writing.
Whale demand for TRX spikes 450% after WLFI’s $4.7M purchase
Within the broader market, TRX has outperformed BTC, ETH, and Cardano since Trump’s inauguration, driven by bullish momentum from WLFI’s $4.6 million purchase of TRX tokens.
However, the catalysts go beyond improved social sentiment. On-chain data reveals an unusually high volume of whale demand since the inauguration, indicating that institutional investors are acquiring TRX, mirroring WLFI’s trades.
IntoTheBlock’s Whale Transaction Volume chart, which tracks the total dollar value of TRX transactions exceeding $100,000 daily, highlights changes in whale activity during key market events.
The total volume of large transactions on the Tron blockchain reached $208.4 million on Monday. However, since Justin Sun began highlighting WLFI’s rapid TRX purchases, large transaction volume has surged by an impressive 450%, reaching $942 million by Wednesday, according to the latest data.
This spike in TRX whale activity supports the narrative of large corporate investors mirroring Trump-related trades via WLFI’s on-chain portfolio. This market dynamic suggests a bullish outlook for TRX for two main reasons:
First, the 450% surge in TRX whale transactions increases short-term liquidity, allowing profit-takers to exit without halting upward price momentum.
Beyond that, Trump’s firm investing heavily in TRX boosts the perceived legitimacy and technical credibility of the Tron network. This positions TRX for significant growth, especially if
Trump implements the crypto-friendly policies widely promised during the Democratic campaign.
Tron (TRX) Price Forecast; Can Trump-fuelled rally reach $0.40?
Tron (TRX) shows promising signs of a continued rally as it trades near $0.2529, supported by an Elliott Wave structure. A clear “ABC” corrective wave is visible, with TRX consolidating above the key support at $0.2442.
A breakout above the resistance at $0.2716 could initiate a significant move toward the psychological $0.30 level, with $0.40 as an extended target in the bullish scenario.
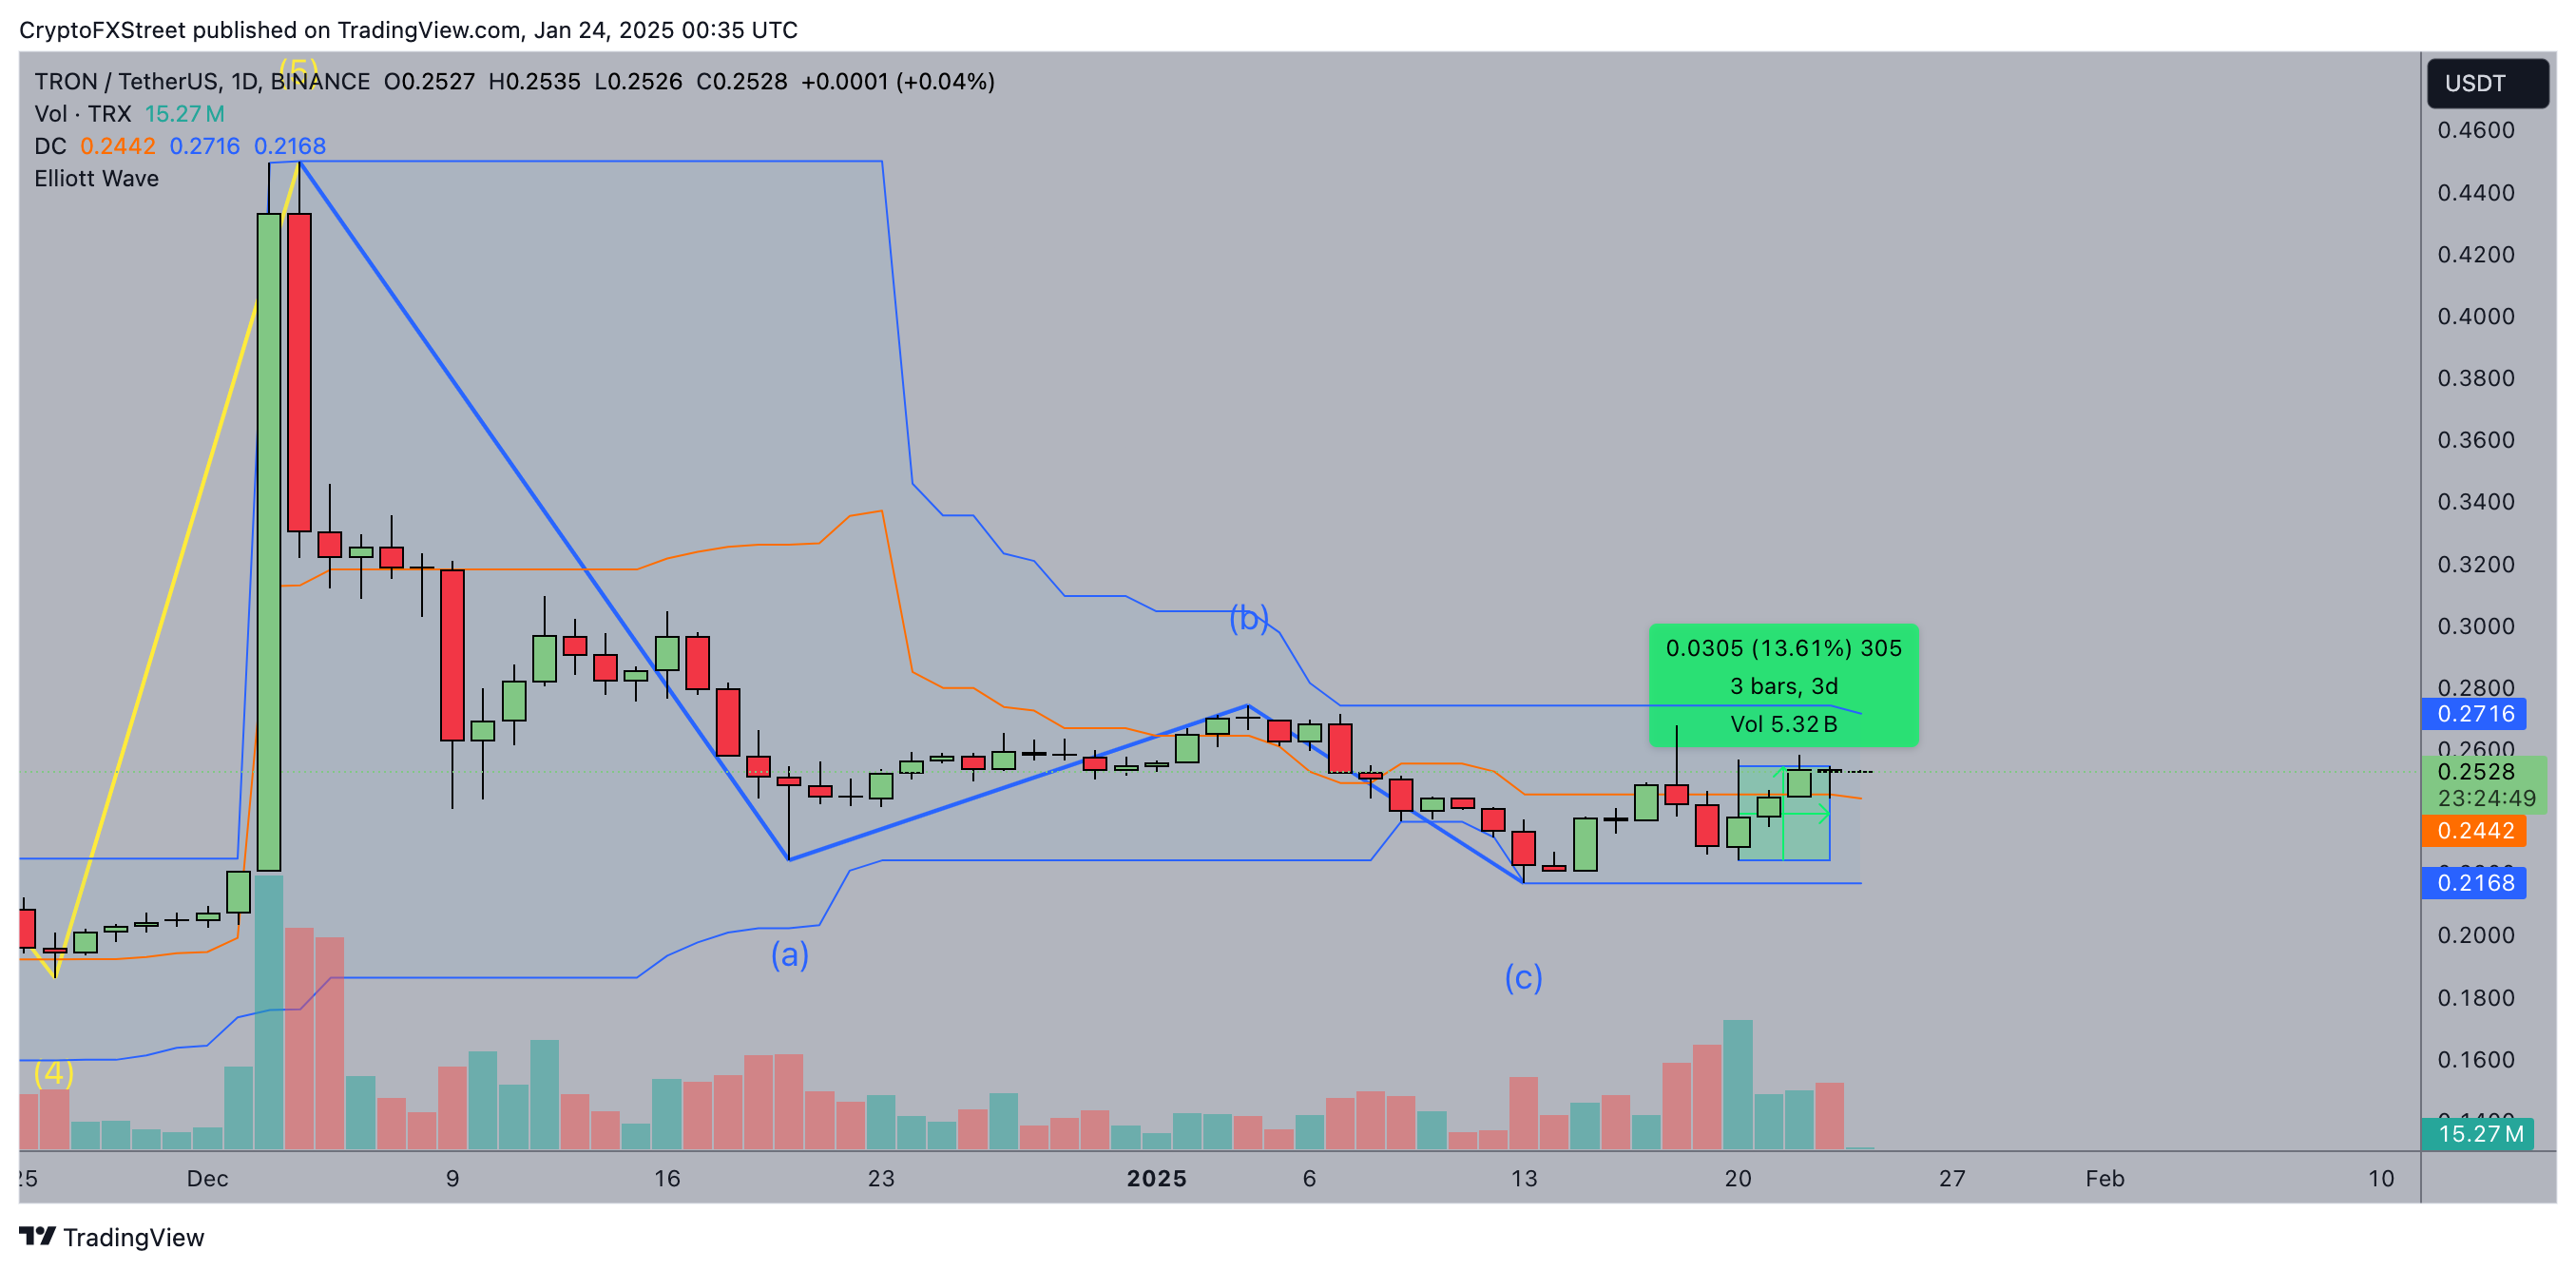
The narrowing Bollinger Bands reflect decreased volatility, often preceding strong directional moves. TRX’s bullish case is supported by increasing volume on recent green candles, indicating heightened buyer interest.
If TRX can clear the $0.2716 resistance, a breakout could reach $0.40 based on the measured move of its Elliott Wave pattern.
However, failure to maintain support at $0.2442 could invalidate the constructive structure. In this case, TRX risks sliding toward $0.2168, the lower Bollinger Band and a critical support level.
Author

Ibrahim Ajibade
FXStreet
Ibrahim Ajibade is an accomplished Crypto markets Reporter who began his career in commercial banking. He holds a BSc, Economics, from University of Ibadan.