TRON Price Forecast: TRX nurtures month-long uptrend as $0.07 beckons
- TRON is exchanging hands within the confines of an ascending channel.
- The daily MACD indicator has confirmed the short-term bullish outlook.
- Losses will take precedence if the channel's middle boundary resistance remains unshaken.

TRON appears to have sustained an uptrend while recovering from the losses incurred in February. The rebound has been gradual but consistent. However, the resistance at $0.07 continues to cap price movement. At the time of writing, TRX is doddering at $0.59 amid the bulls' relentless push for gains to higher price levels.
TRON uptrend intact despite lethargic market action
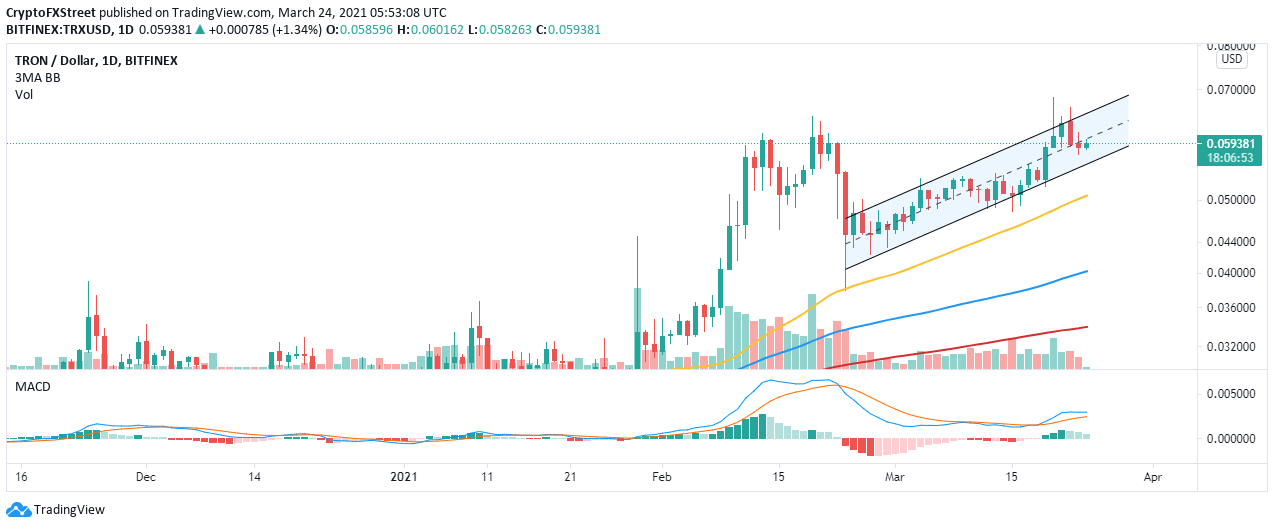
TRON is trading slightly below the ascending channel's middle boundary resistance. The price has remained within the confines of this pattern for more than a month. Its lower boundary support has played a key role in ensuring that bears are kept in check.
In the meantime, cracking the middle boundary resistance would bolter TRX massively toward the crucial hurdle at $0.07. The ongoing uptrend, although gradual, has been validated by the Moving Average Convergence Divergence (MACD) indicator on the daily chart. The MACD line (blue) is holding above the mean line, further cementing the bulls' presence.
TRX/USD daily chart
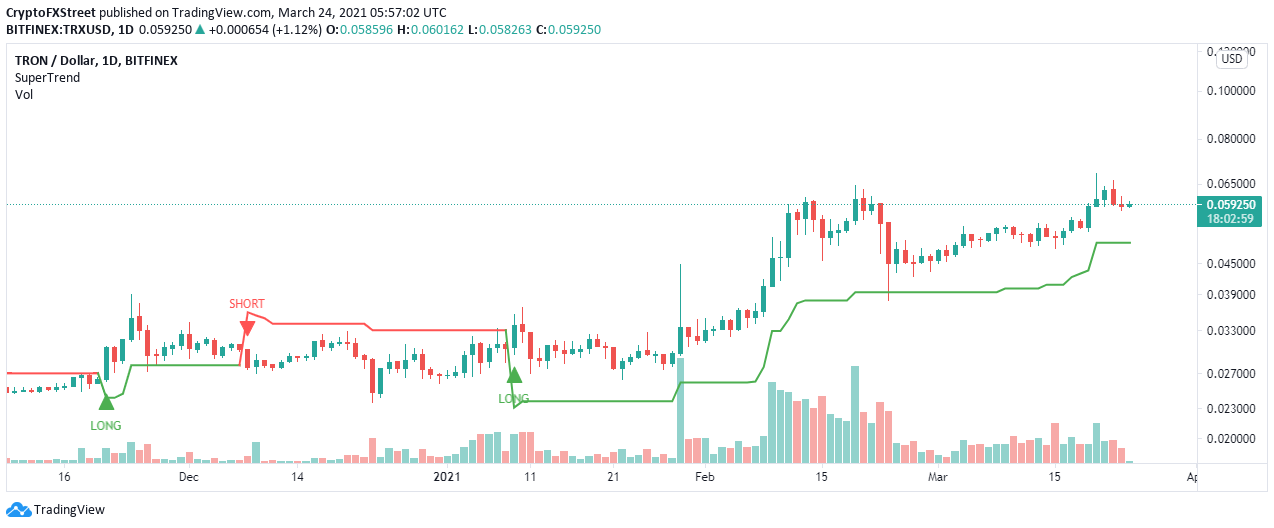
The SuperTrend indicator on the same daily chart shows that TRON is in the bulls' hands. This technical indicator illustrates the general direction of an asset's trend. The trend is bullish when the SuperTrend indicator is green and below the price.
TRX/USD daily chart
Looking at the other side of the fence
The immediate resistance at the ascending channel's middle boundary must come down for gains to $0.07 to materialize. However, TRON will be forced to retest the lower edge of the channel for support. If push comes to shove and massive sell orders are triggered, we will likely witness losses to $0.05, with support highlighted by the 50 Simple Moving Average (SMA) on the daily chart.
Author

John Isige
FXStreet
John Isige is a seasoned cryptocurrency journalist and markets analyst committed to delivering high-quality, actionable insights tailored to traders, investors, and crypto enthusiasts. He enjoys deep dives into emerging Web3 tren



