Tron Price Prediction: TRX prepares for a 30% jump, eying up $0.07
- Tron price has found a strong support trendline on the 4-hour chart.
- The digital asset faces only one significant barrier before a potential 30% breakout.
- TRX must not lose the key support level at $0.052 to avoid a significant drop.

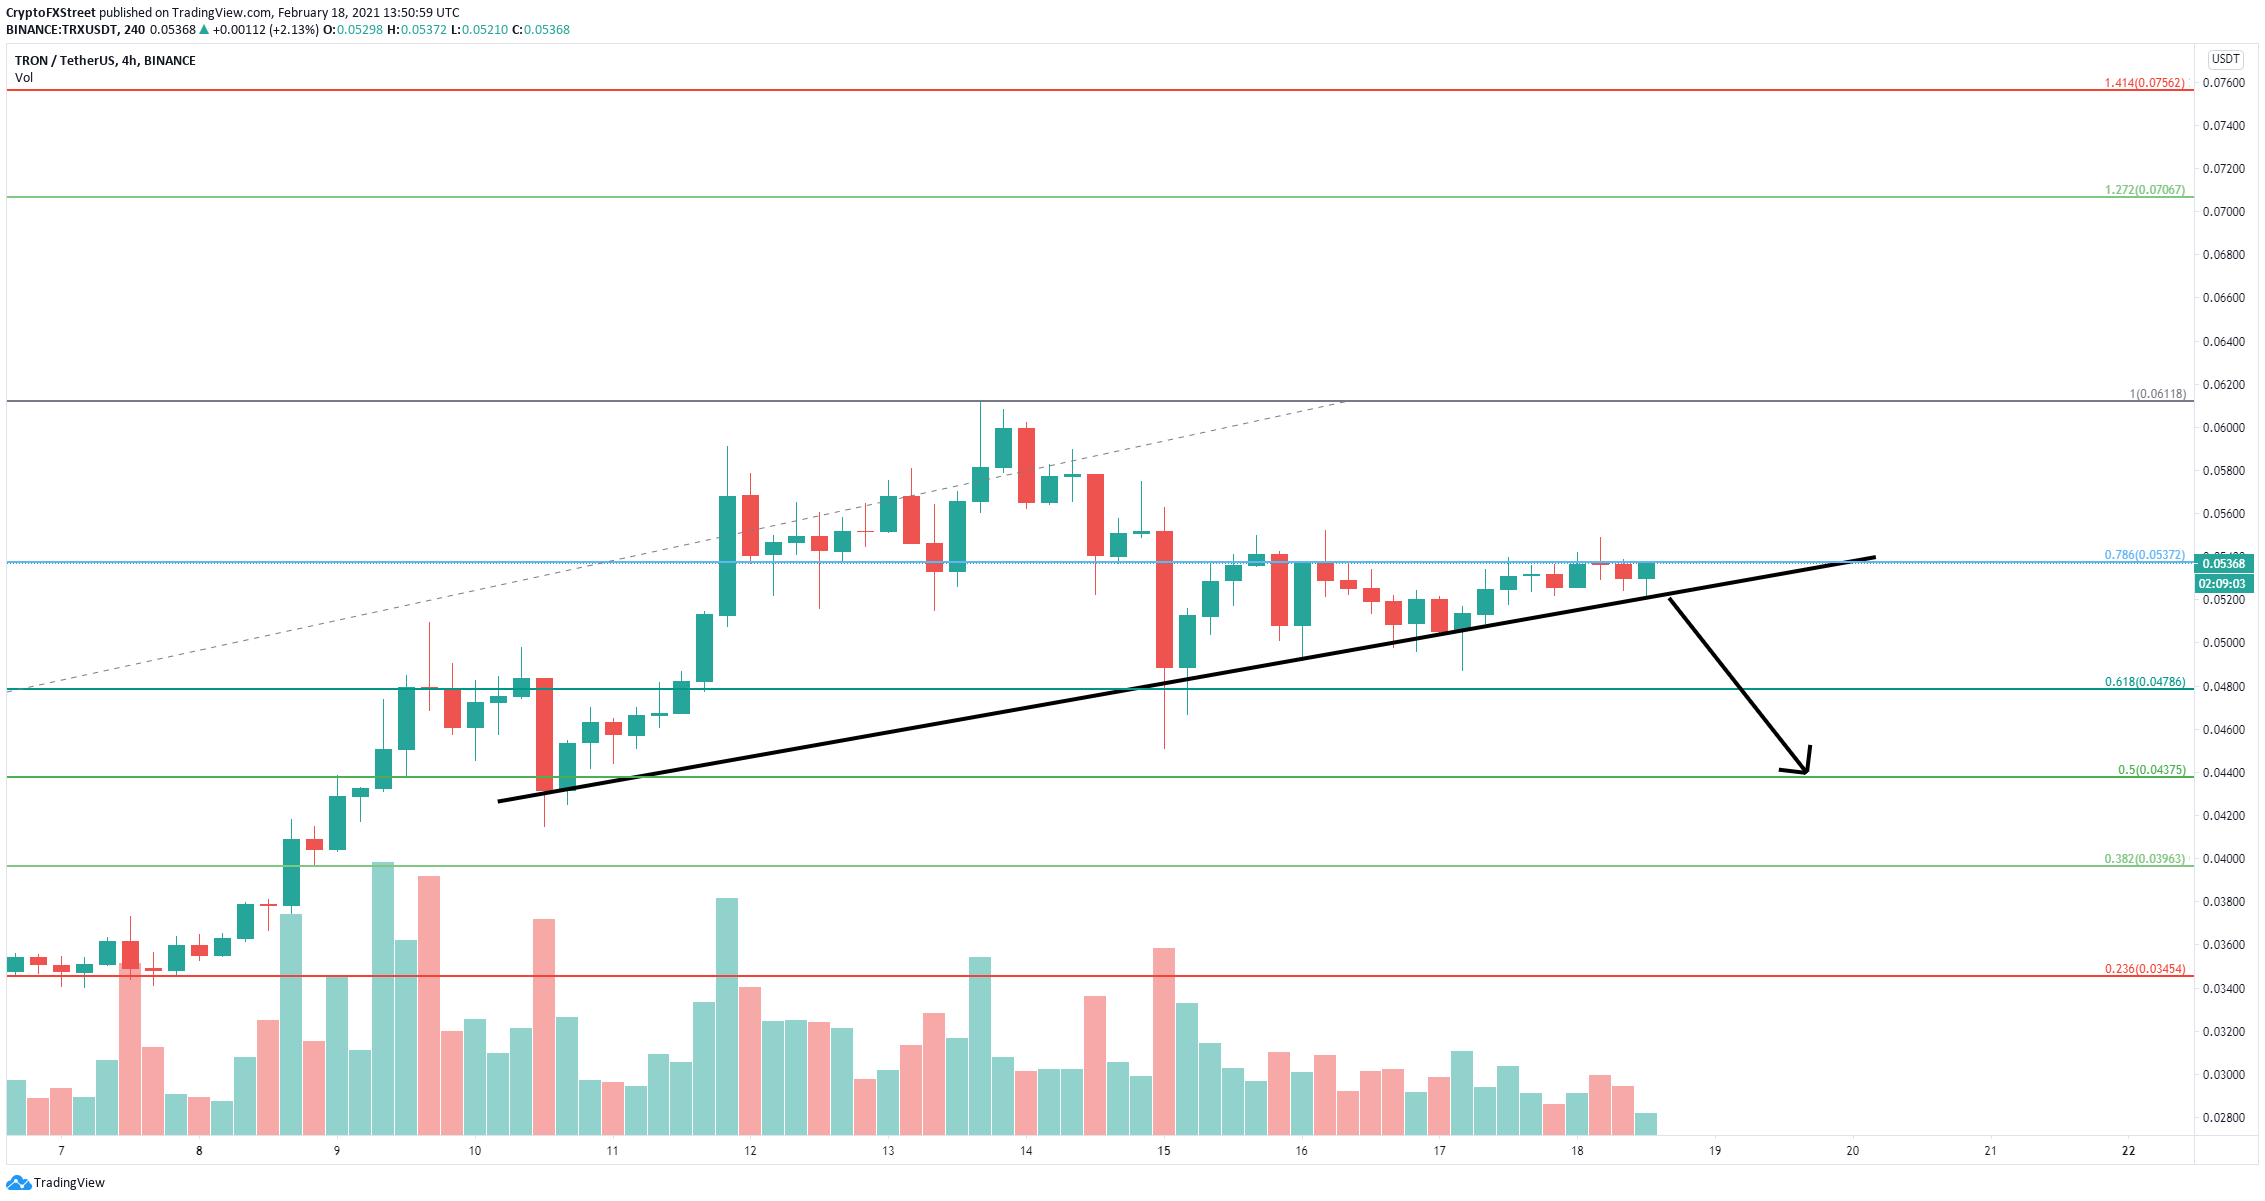
Tron price hit a new 2021-high at $0.061 on February 13 and had a major 25% correction down to $0.045. Since then, the digital asset has established a robust support trendline and aims for a breakout above a crucial resistance point.
Tron price is on the verge of a 30% move
On the 4-hour chart, TRX bulls have established a strong support trendline formed since February 10. The critical resistance level is $0.0537, which is the 78.6% Fibonacci level of the $0.027 to $0.061 rally.
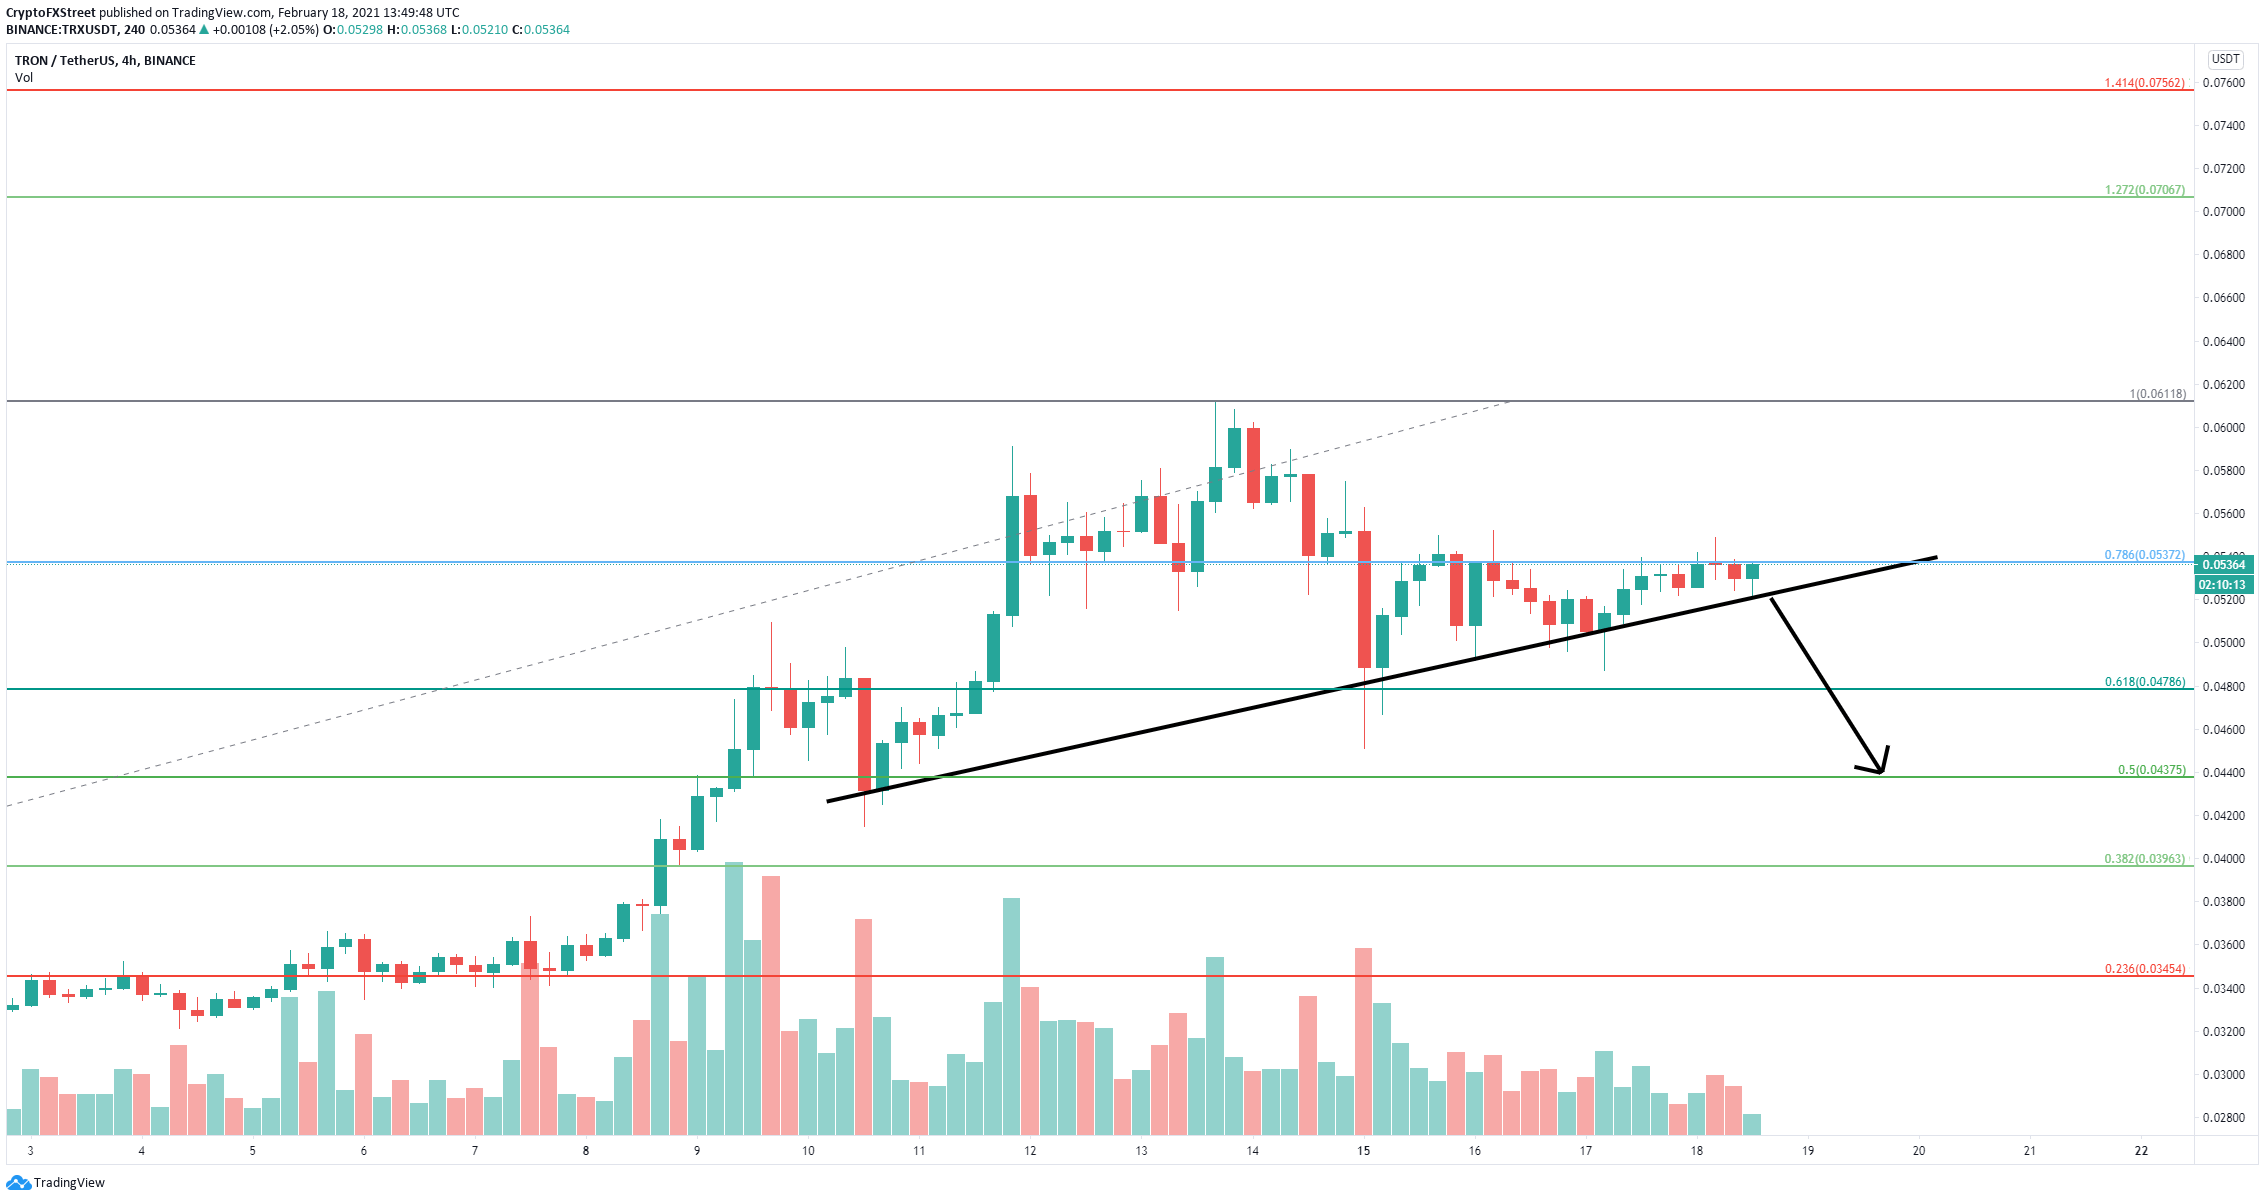
TRX/USD 4-hour chart
Tron price has been rejected several times from this crucial resistance point. A breakout above $0.0537 will quickly push Tron price to at least the last high of $0.061 and potentially as high as $0.07, which is the 127.2% Fibonacci level.
TRX/USD 4-hour chart
On the other hand, if the bulls can't hold the key support trendline, Tron price can quickly dive towards the 61.8% Fibonacci level at $0.047 and the 50% level at $0.0437. TRX could drop as low as $0.039 at the 38.2% Fib level.
Author

Lorenzo Stroe
Independent Analyst
Lorenzo is an experienced Technical Analyst and Content Writer who has been working in the cryptocurrency industry since 2012. He also has a passion for trading.


