Top 3 Price Prediction Bitcoin, Ethereum, XRP: Crypto markets position for new bullish expansion phase
- Bitcoin rallies over 20% in a week, fulfills bullish Ichimoku breakout conditions.
- Ethereum grabs 25% gain in a week and pushes on towards $4,000.
- XRP struggles to generate significant momentum despite a 22% move higher.

Bitcoin price fulfills all conditions necessary to complete an Ideal Bullish Ichimoku Breakout setup. Ethereum price, hot on the tail of Bitcoin’s performance, positions for the same Ichimoku breakout as Bitcoin. However, XRP price action is somewhat muted when compared to its peers and shows signs of struggling to catch the same momentum as Bitcoin and Ethereum.
Bitcoin price looks for a clear and sustained break above $50,000 to move towards $70,000
Bitcoin price has fulfilled all the Ideal Bullish Ichimoku Breakout entry requirements within the Ichimoku Kinko Hyo system. The Chikou Span is above the candlesticks; the close is above the Cloud, Future Senkou Span A is sloping up while future Senkou Span B is sloping down and the Tenkan-Sen is above the Kijun-Sen. The only technicals that could derail the sustained move higher are the hidden bearish divergence between the candlestick chart and the Composite Index. Therefore, Bitcoin will need to close above the September 6th high of $52,742 to negate any near-term bearish signals in the oscillators.
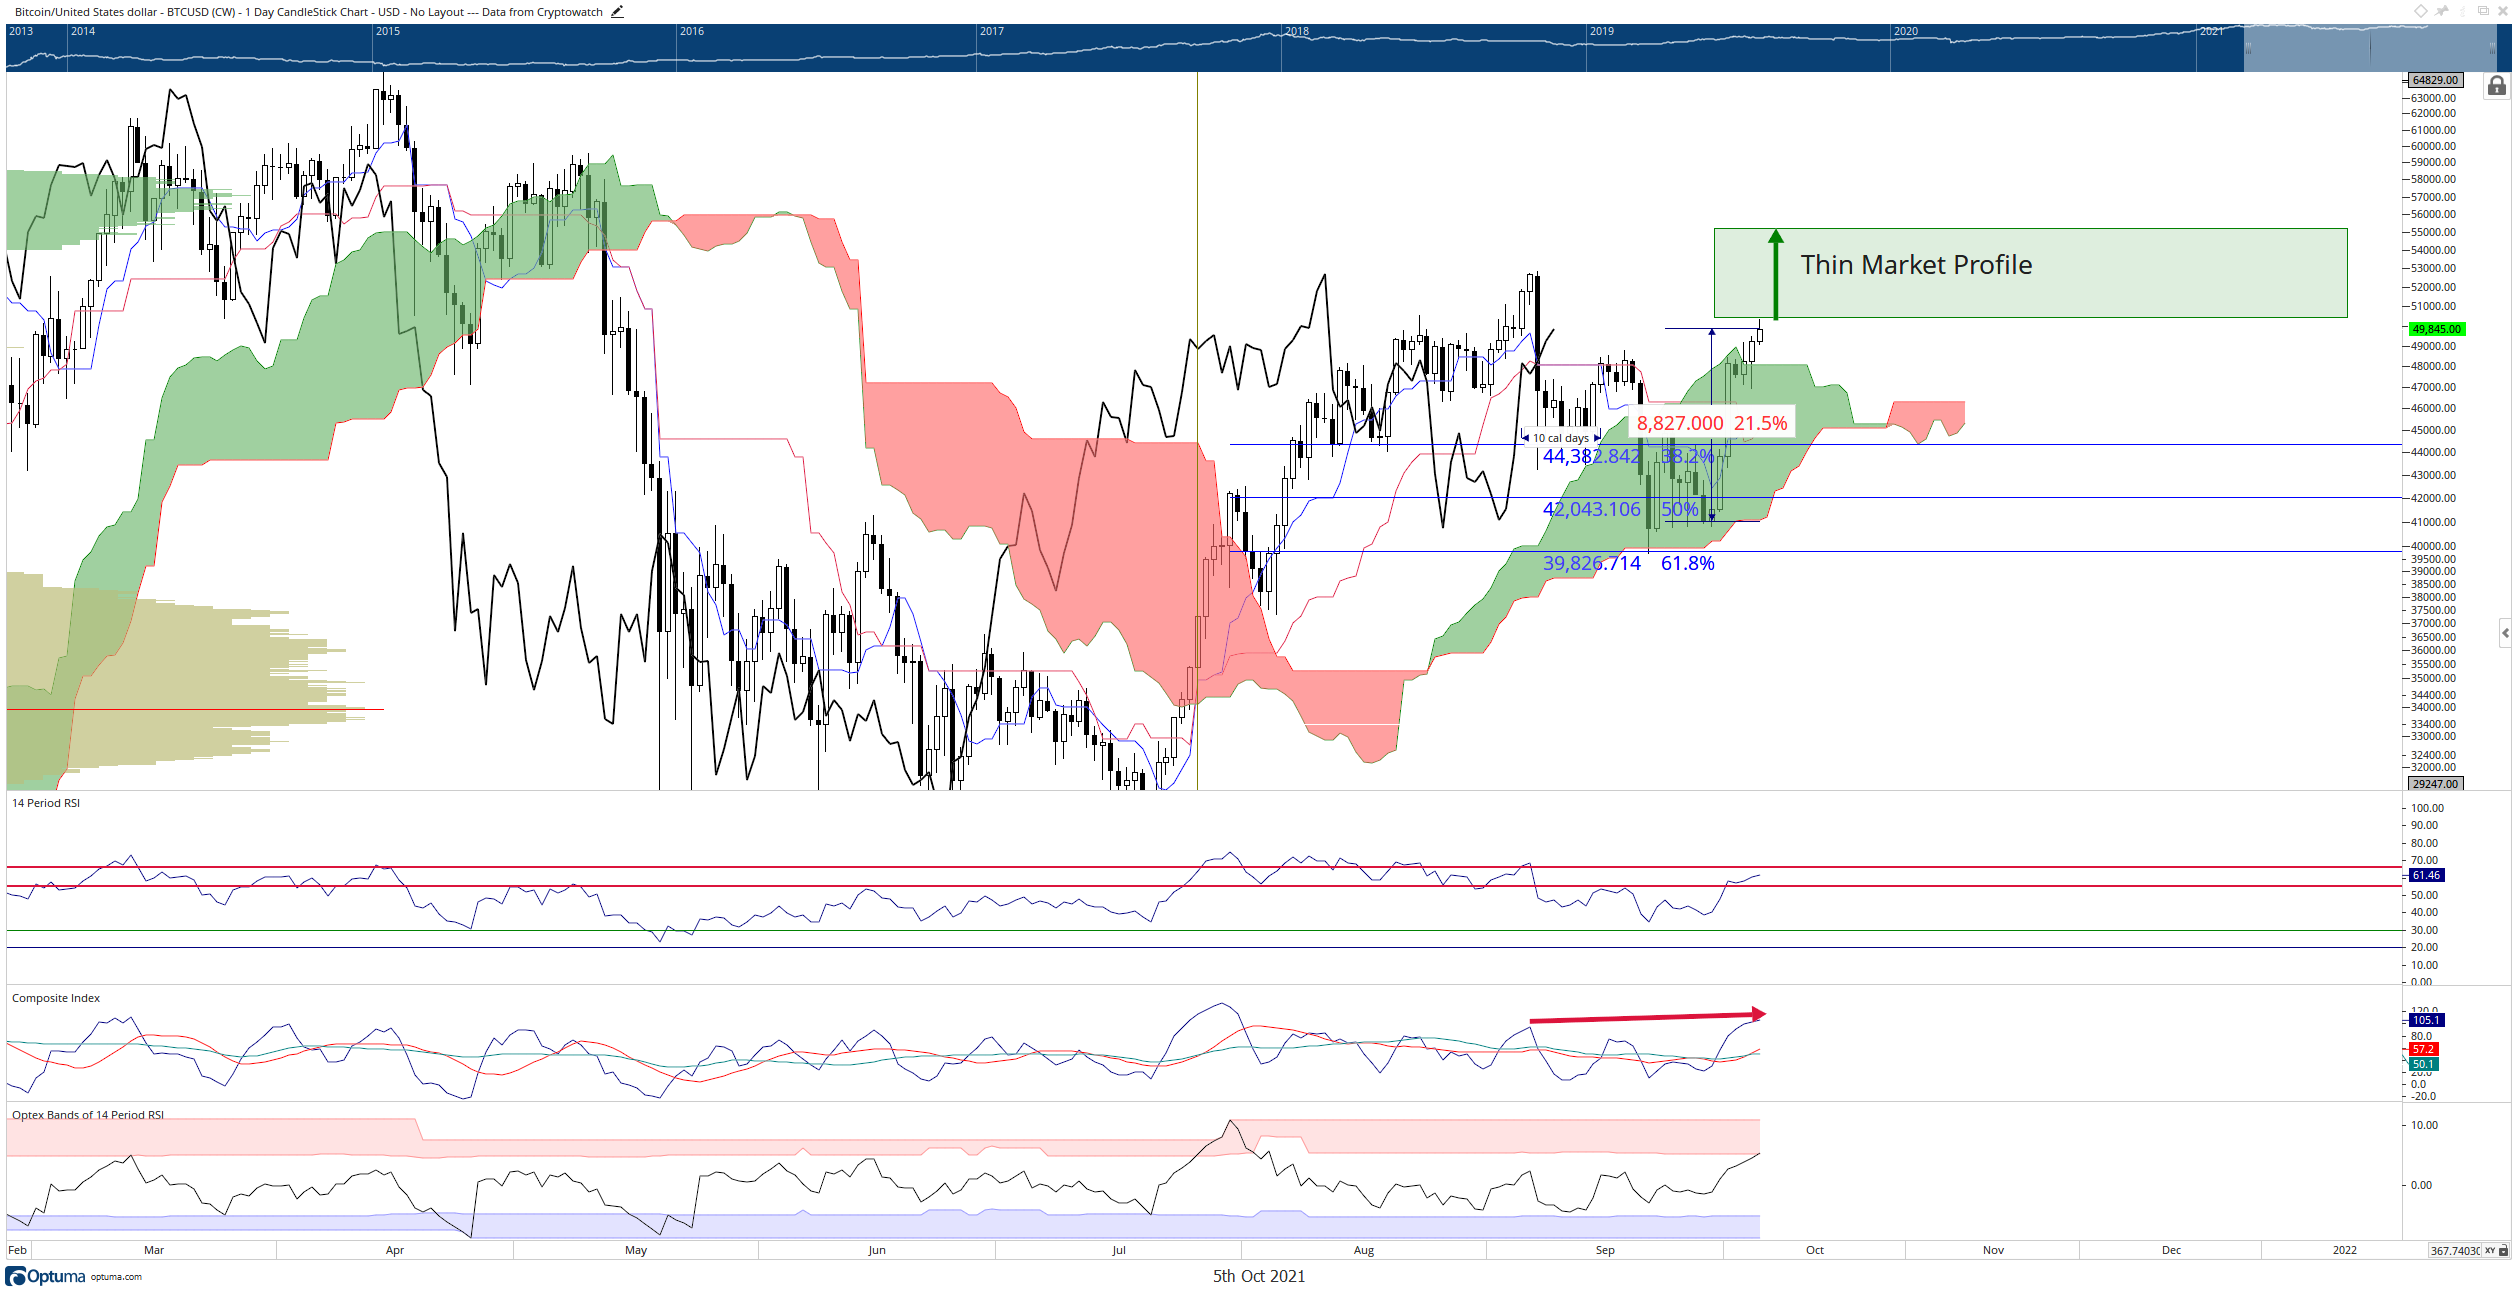
BTC/USD Daily Ichimoku Chart
Bulls should be cautious of any return to the inside of the Cloud as it could signal another leg lower towards the $30,000 value area.
Ethereum price attempts a breakout higher; bulls target $3,600 close to confirm a new bullish expansion
Ethereum price, unlike Bitcoin, remains inside the Cloud has stubbornly been rejected higher from the top of the Cloud (Senkou Span A) at $3,500. For a bullish breakout to be true, the close and the Chikou Span must be above the Cloud, with the Chikou Span also above the candlesticks. This can only occur with a close at or above $3,600. Until then, downside pressure remains a very likely scenario. The same hidden bearish divergence scenario on Bitcoin’s chart exists for Ethereum as well. To negate that bearish divergence and eliminate any downside pressure threat, a close above $4,000 is necessary.
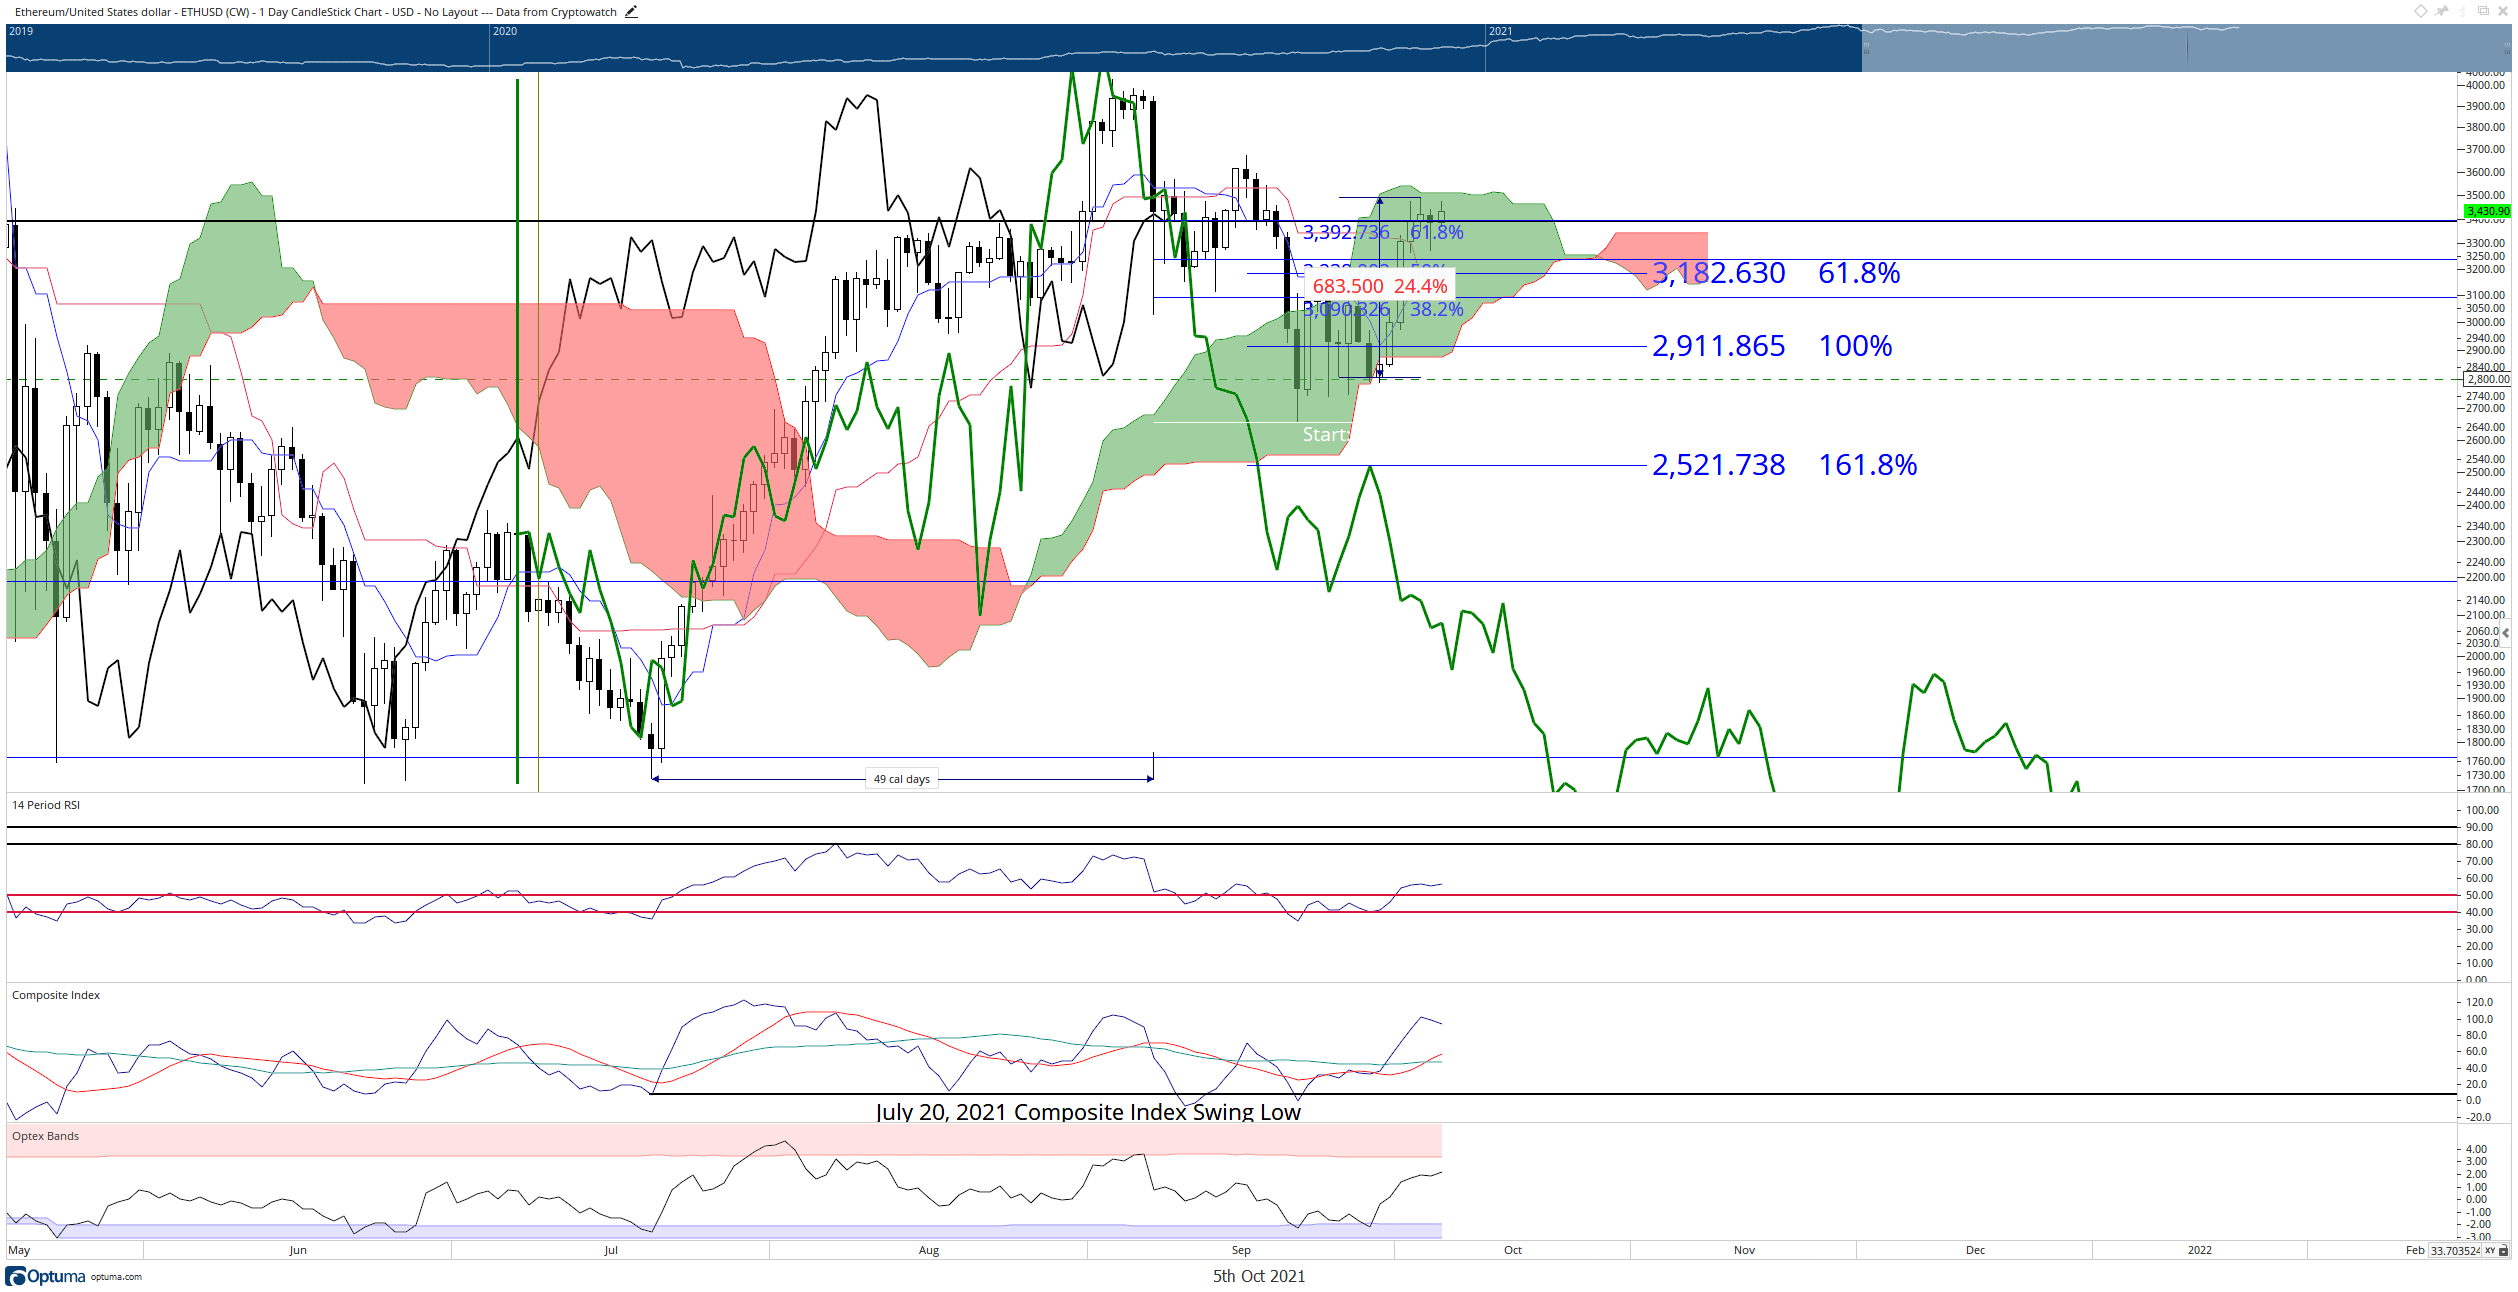
ETH/USD Daily Ichimoku Chart
Ethereum price dropping below $3,000 would be a signal that further downside movement is likely.
XRP struggles to maintain bullish momentum, eyes a return to $0.90
XRP price continues to struggle higher and is now under threat from losing most of its gains over the past week. The Kijun-Sen at $1.05 continues to act as a source of significant resistance. The bearish readings in the oscillators exacerbate the resistance at the Kijun-Sen. The Optex Bands continue to trend higher and are nearing the extreme overbought levels. Hidden bearish divergence between the candlestick chart and the Composite Index also weighs in on further downside momentum. Finally, the Relative Strength Index faces resistance against the first overbought condition in a bear market at 55. A close above $1.20 is necessary to return XRP into a bull market.
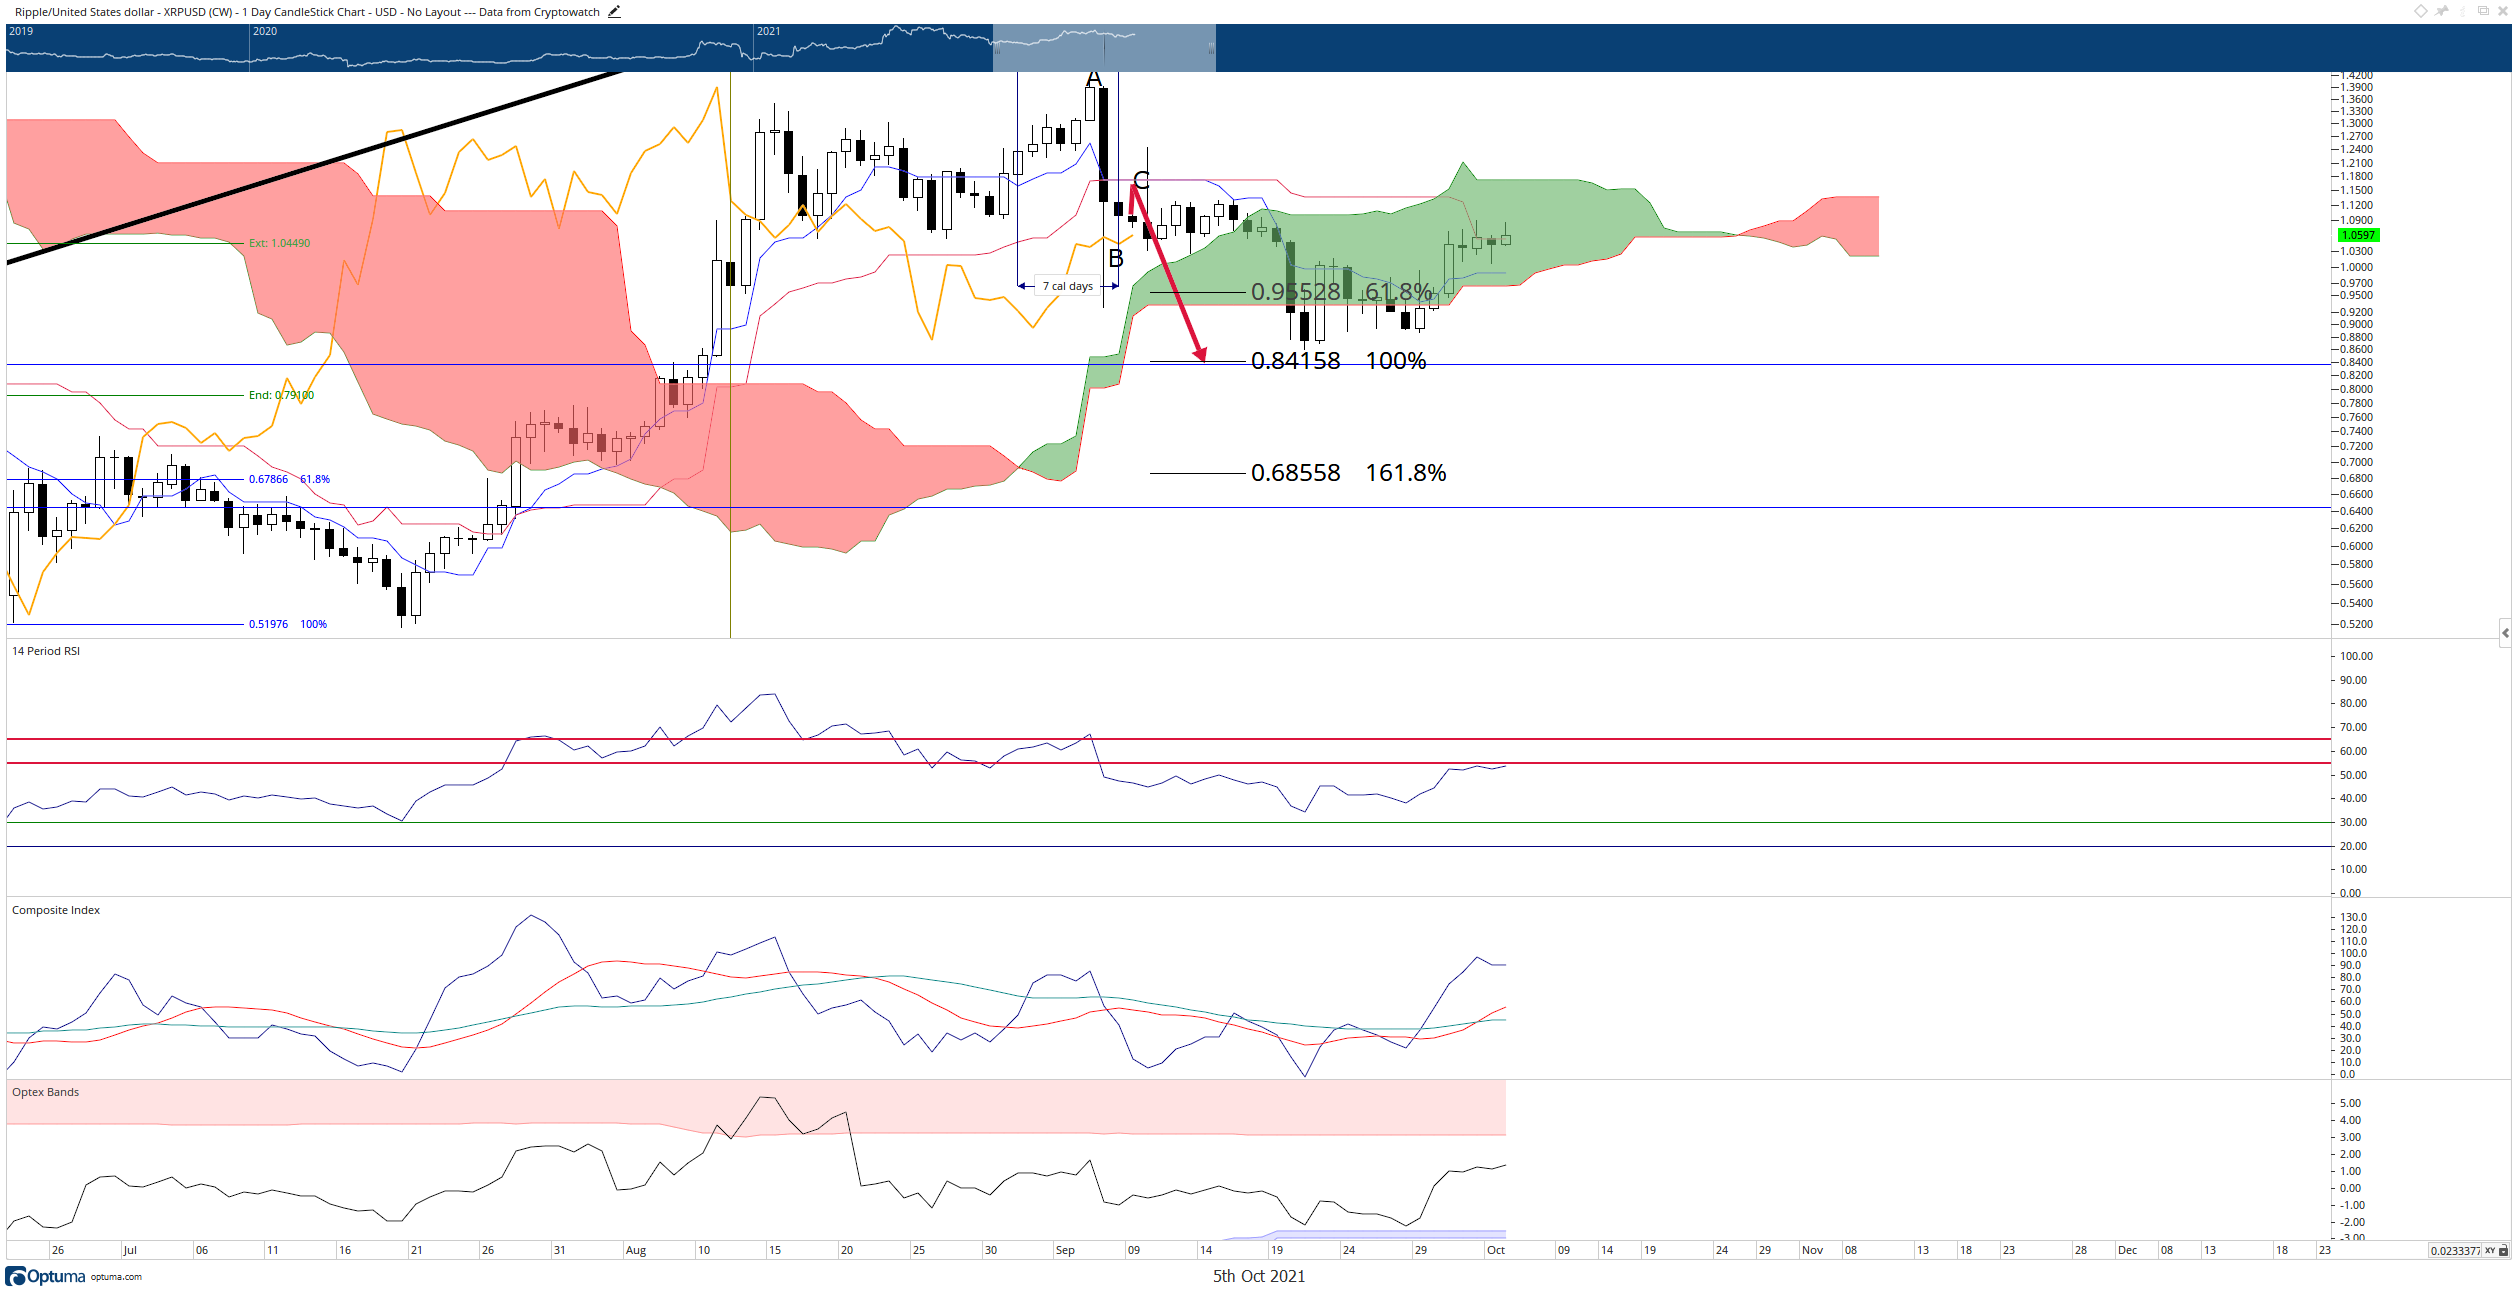
XRP/USD Daily Ichimoku Chart
XRP may trigger some substantial price collapses if it fails to hold $1.00.
Like this article? Help us with some feedback by answering this survey:
Author

Jonathan Morgan
Independent Analyst
Jonathan has been working as an Independent future, forex, and cryptocurrency trader and analyst for 8 years. He also has been writing for the past 5 years.


