Three reasons why Ethereum price is going to $5,000
- Ethereum price has breached a bull flag pattern, forecasting a $4,816 target.
- Transactional data shows entry into the price discovery phase is closer than anticipated.
- ETH dominance chart adds credence and hints at an explosive rally.

Ethereum price breached a crucial barrier, kick-starting a part of the massive uptrend that awaits it. While the short-term outlook for ETH might be concerning based on some metrics, others indicate that the long-term scenario remains largely bullish.
Ethereum price consolidates to move higher
Ethereum price is currently forming a bull flag. ETH rose 134% between July 20 and September 3, creating a flagpole. However, it consolidated soon after in a downward sloping channel, setting up the flag.
This pattern forecasts a 57% ascent, obtained by measuring the flagpole’s height and adding it to the breakout point. A decisive close above the flag’s upper trend line projects a target of $4,816.
On October 1, Ethereum price embarked on a 17% rally but is currently experiencing a slowdown as it encounters the $3,398 supply barrier. Investors should note that there is a chance for ETH to retrace to $3,202 before rallying higher.
Regardless of a correction, if ETH continues to climb, the barriers at $3,619, $3,952 and $4,380 will try to block its path. Therefore, the buyers need to shatter these hurdles to reach the target of $4,816.
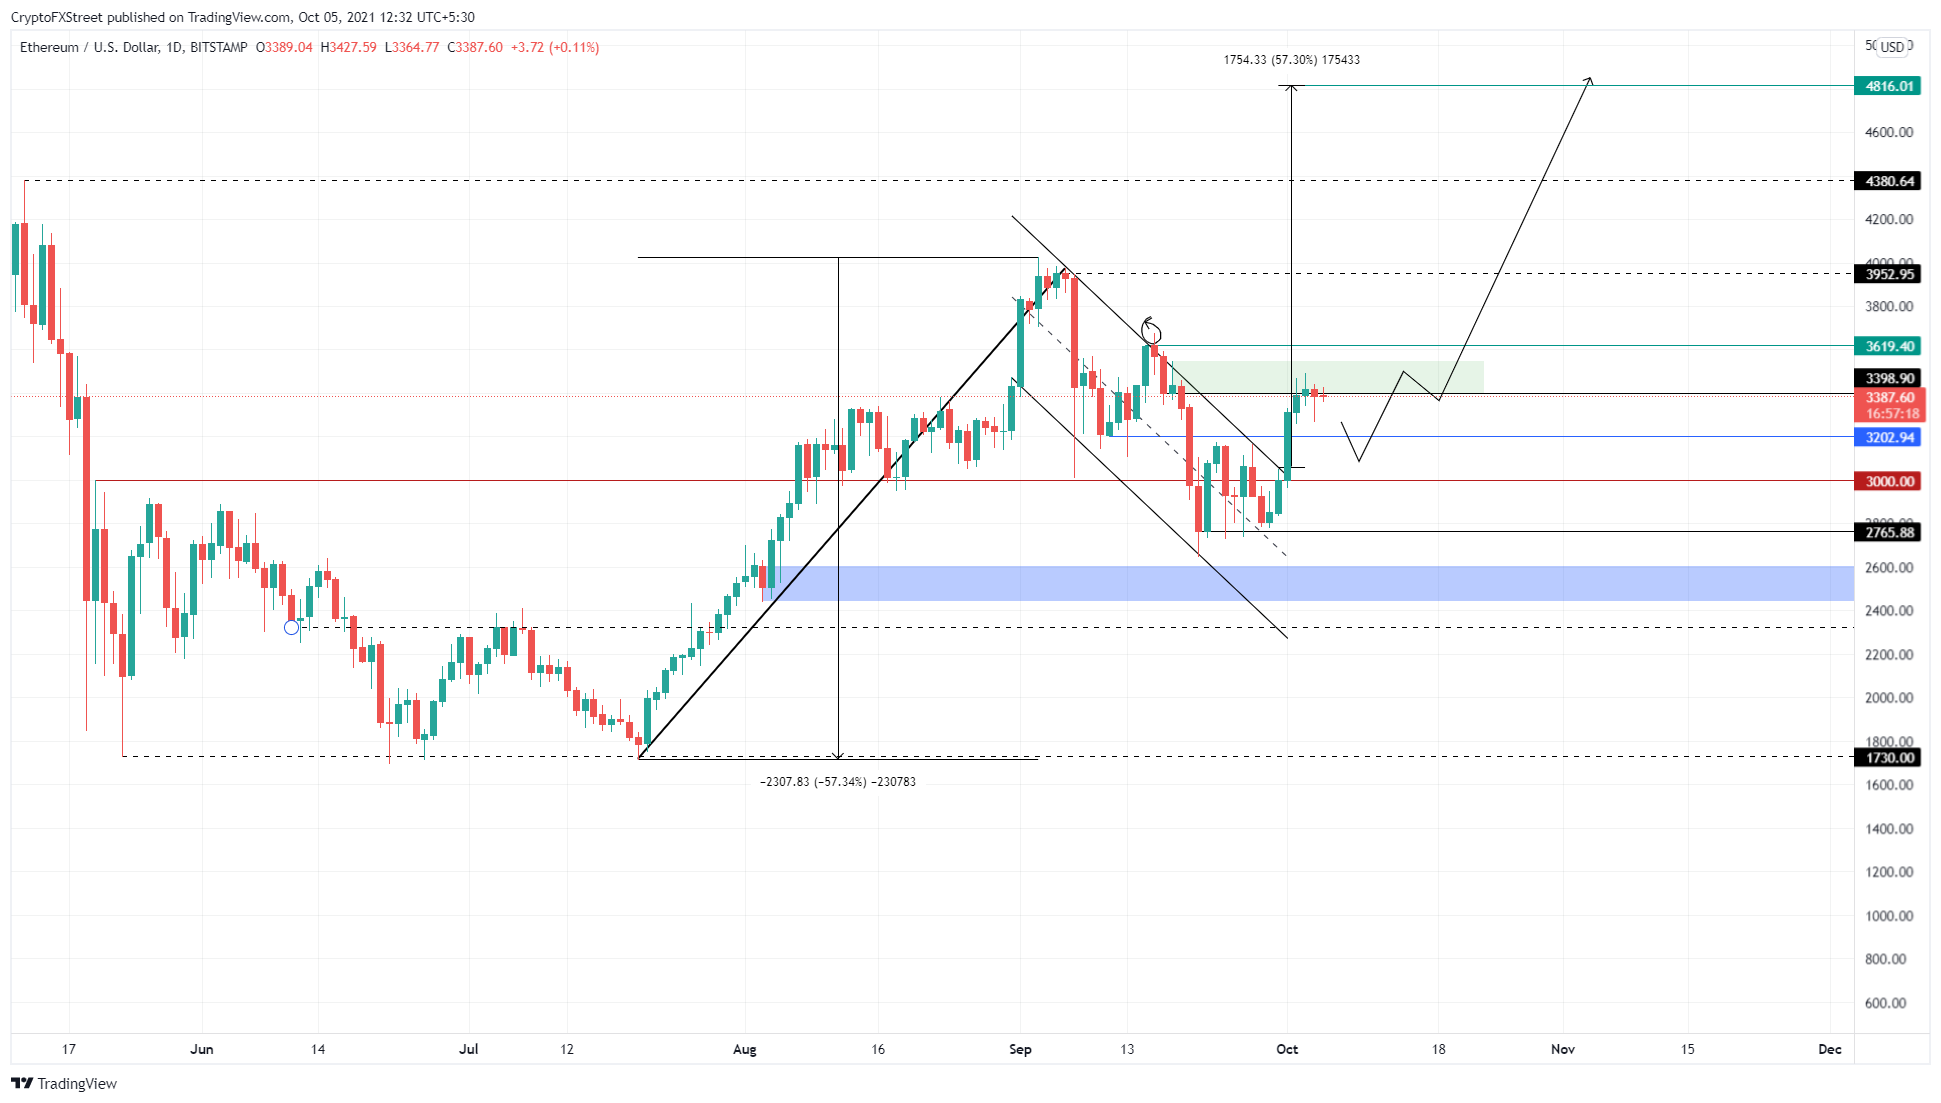
ETH/USD 1-day chart
Supporting the bullish outlook is IntoTheBlock’s Global In/Out of the Money (GIOM) model, which shows little-to-no resistance for ETH beyond $3,815.
Roughly 1.95 million addresses that purchased 3.17 million ETH at an average price of $3,815 are “Out of the Money.” Therefore, a decisive close above $3,815 will convert a majority of the holders to profitable and remove the unwanted selling pressure.
This development could trigger a massive bull run for ETH, pushing it past its all-time high at $4,380 and toward the intended target at $4,816.
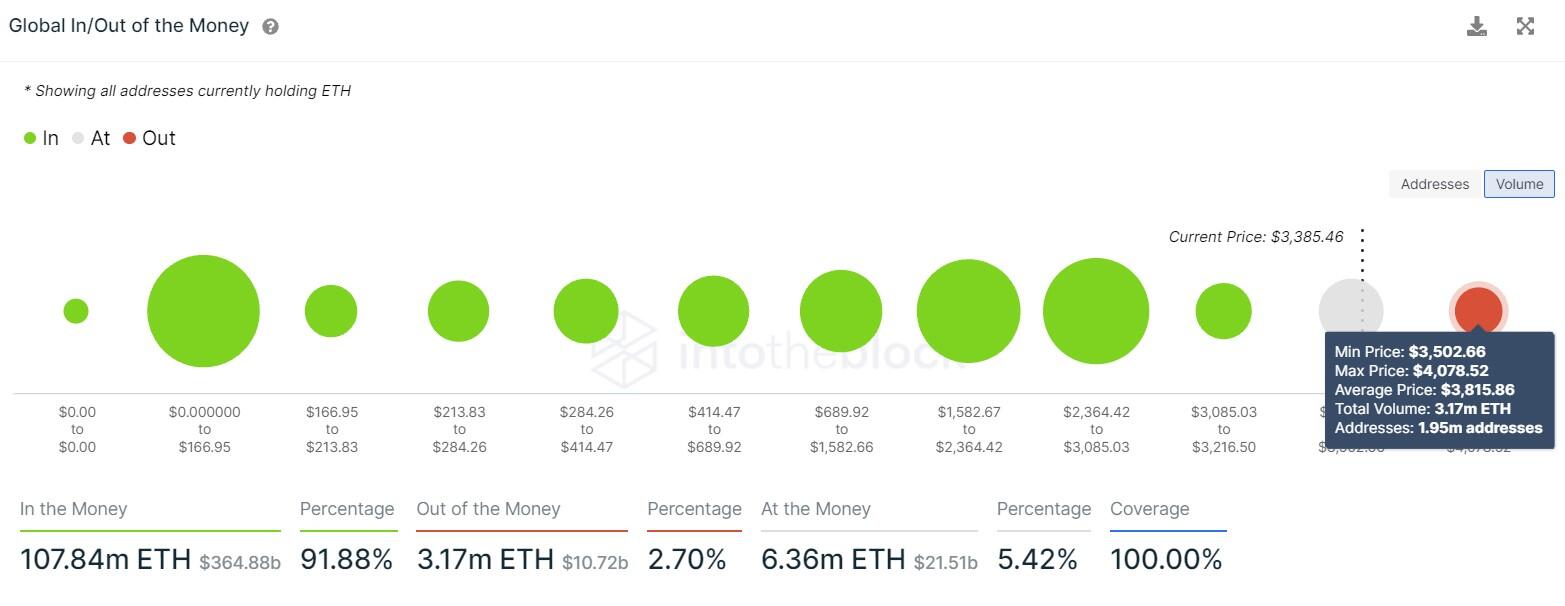
ETH GIOM chart
On the other hand, the dominance of ETH is printing an ascending triangle. This metric is a measure of Ethereum’s market cap relative to the other altcoins.
Based on theoretical projects, this technical formation forecasts a 19% increase in ETH dominance, painting a bullish picture for its future and adding credence to the optimistic thesis detailed above.
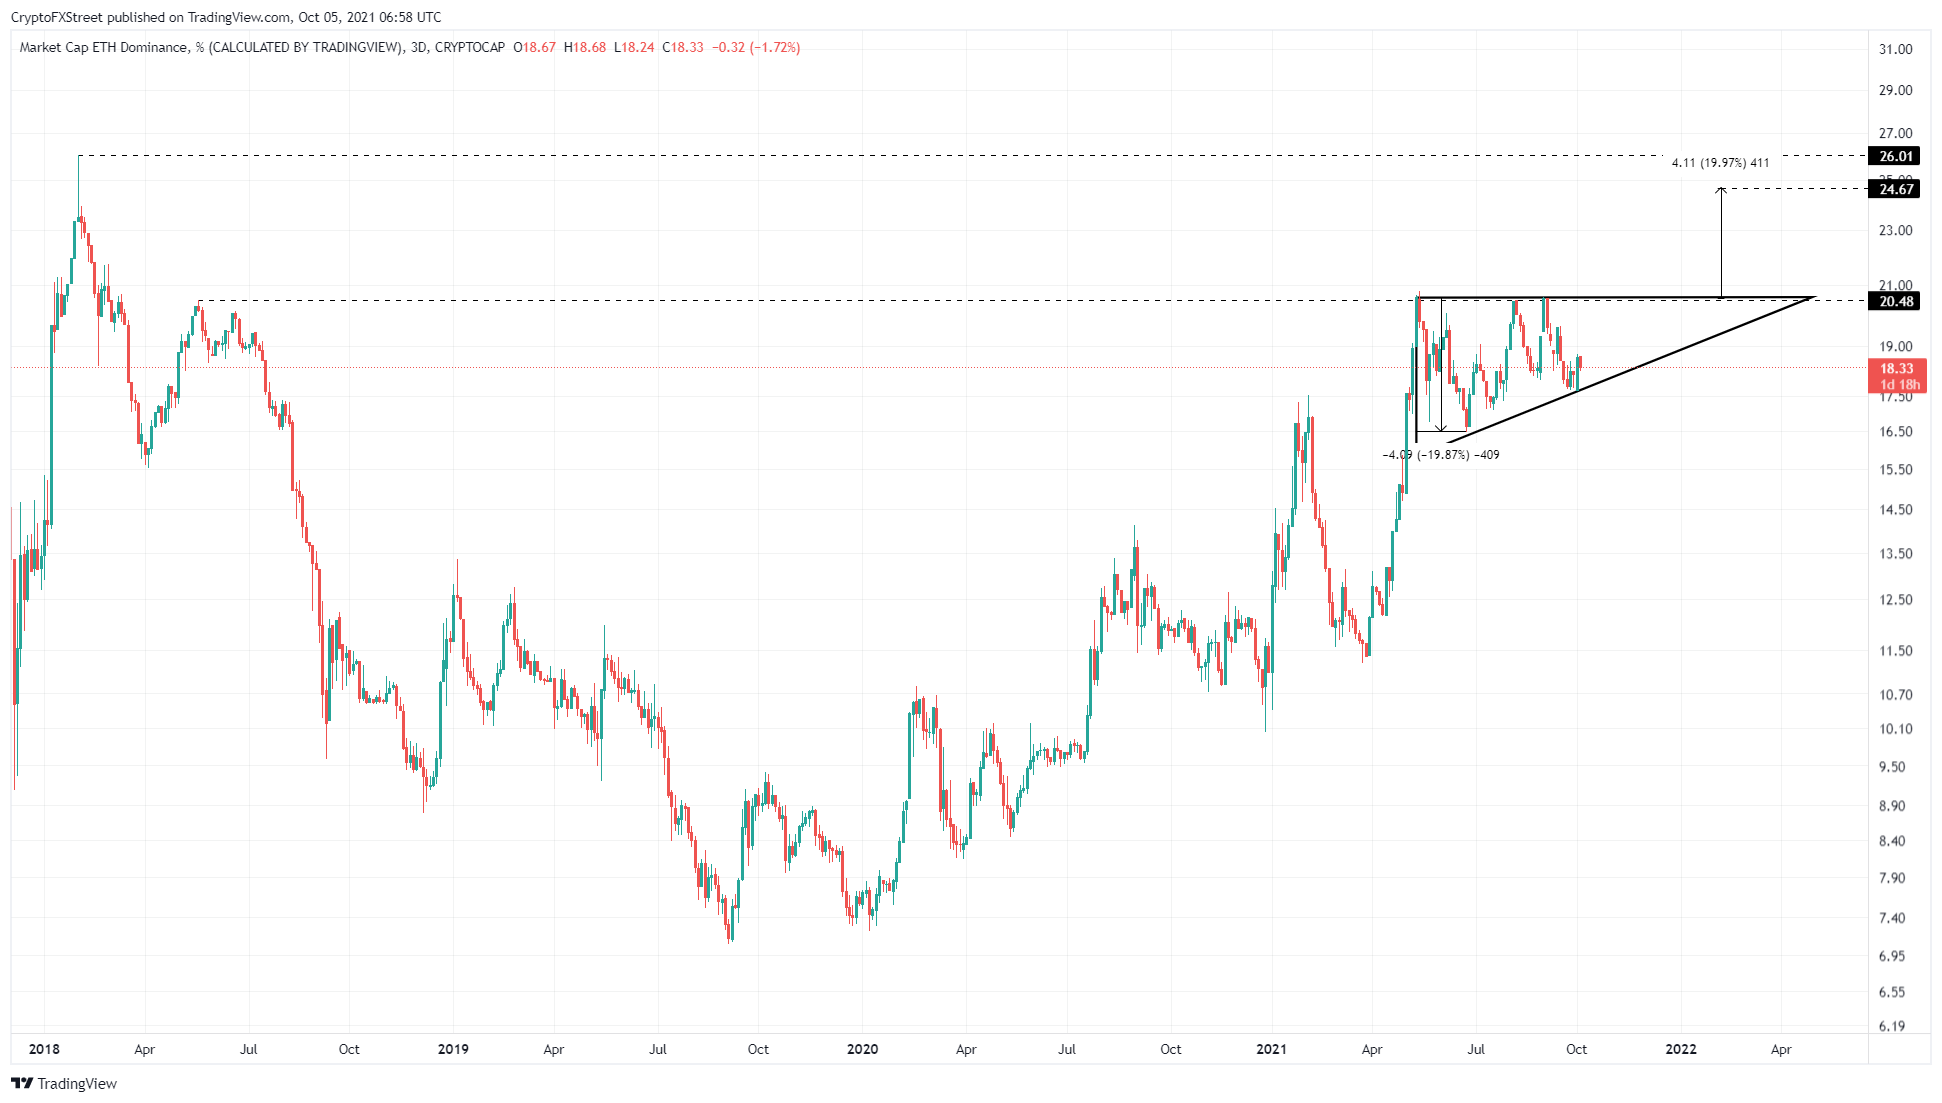
ETH Dominance chart
While things are looking up for Ethereum price from a long-term perspective, the reduction in daily active addresses over the past month despite the increase in price shows that the market participants are still fearful.
As long as there is uncertainty among a large group of holds, there is a chance for a flash crash that pushes Ethereum price down to $3,200.
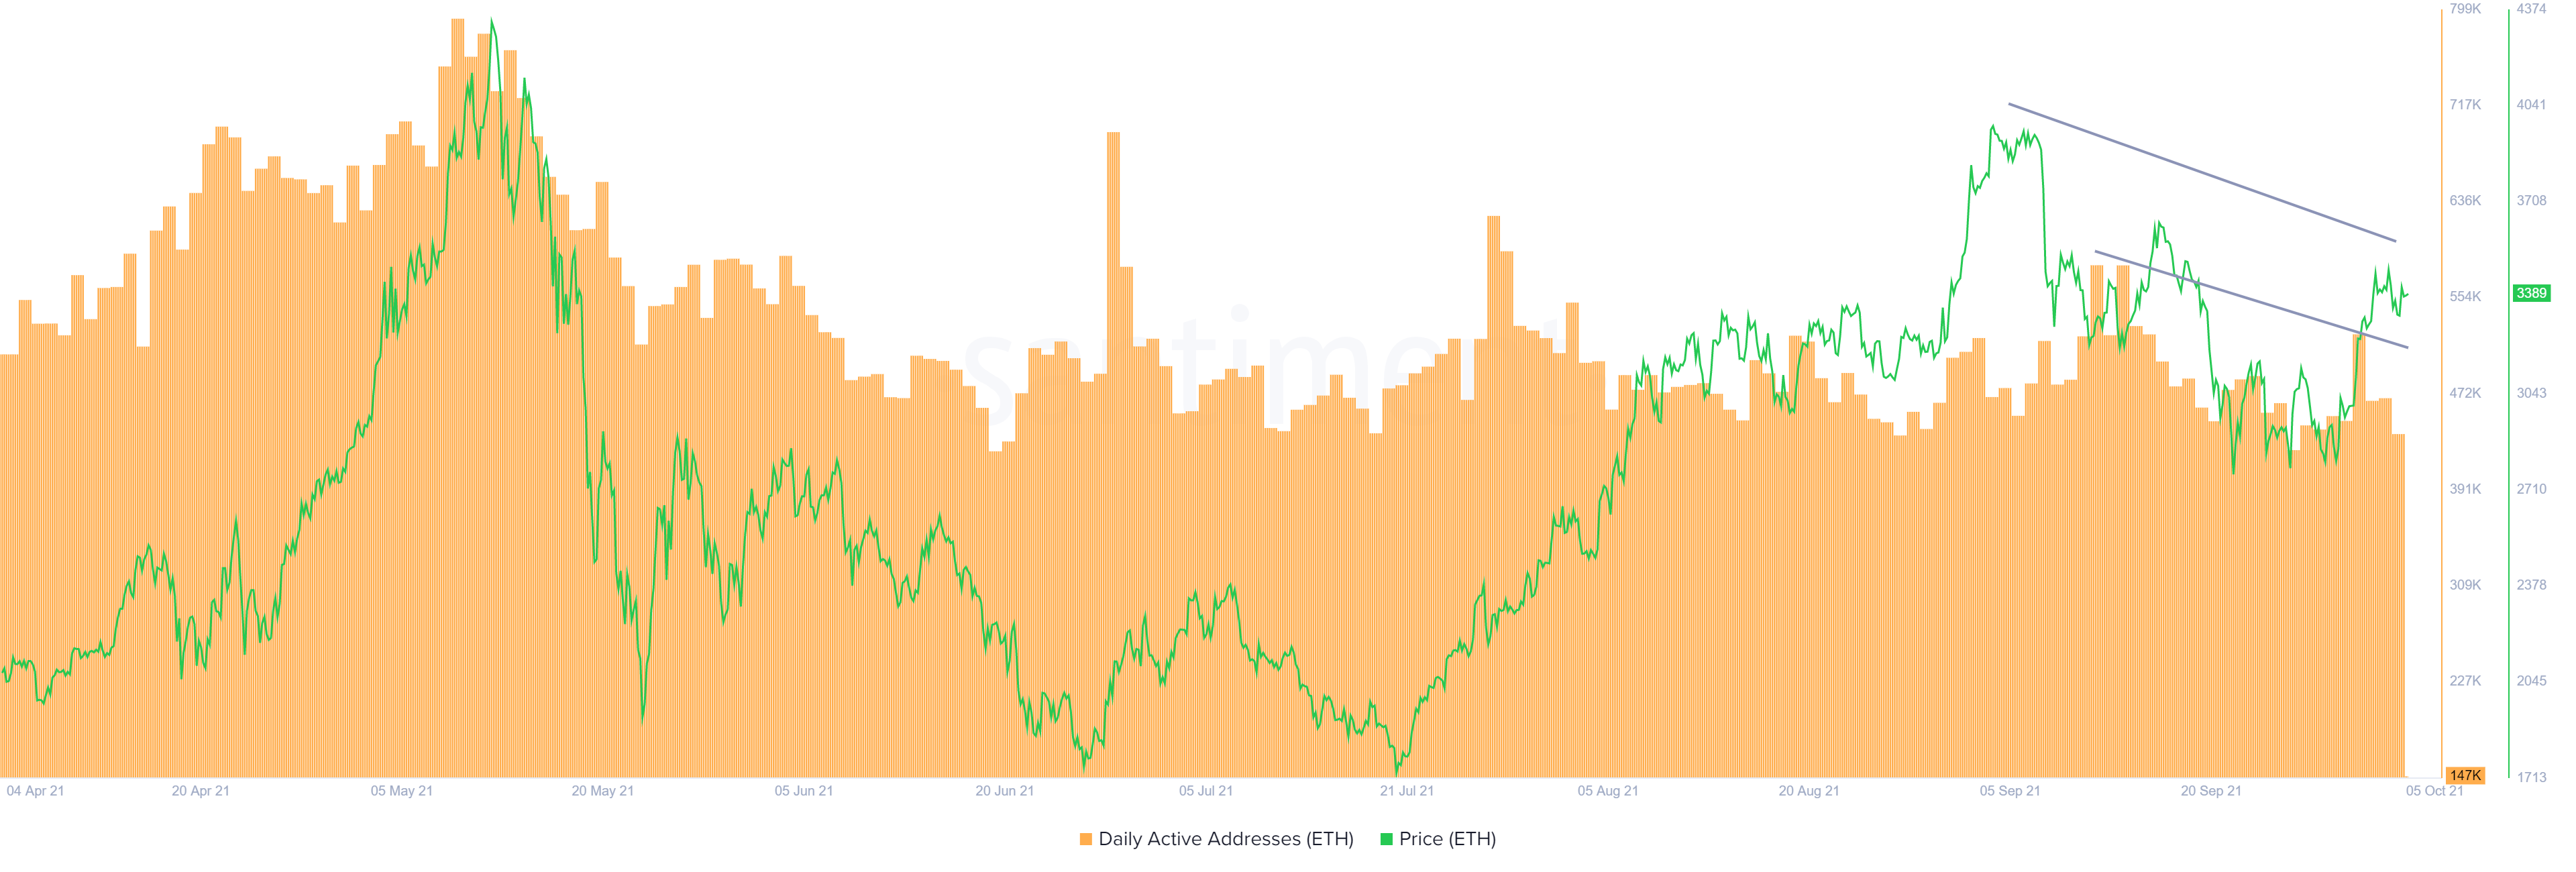
ETH DAA chart
The 365-day Market Value to Realized Value (MVRV) model supports the short-term flash crash thesis. This on-chain metric is used to determine the average profit or loss of investors who purchased ETH over the past year.
Currently, the 365-day MVRV is hovering at 50%, indicating that over half of the market participants that purchased ETH are profitable. Therefore, these investors could book profits, triggering a short-term downswing for Ethereum price.
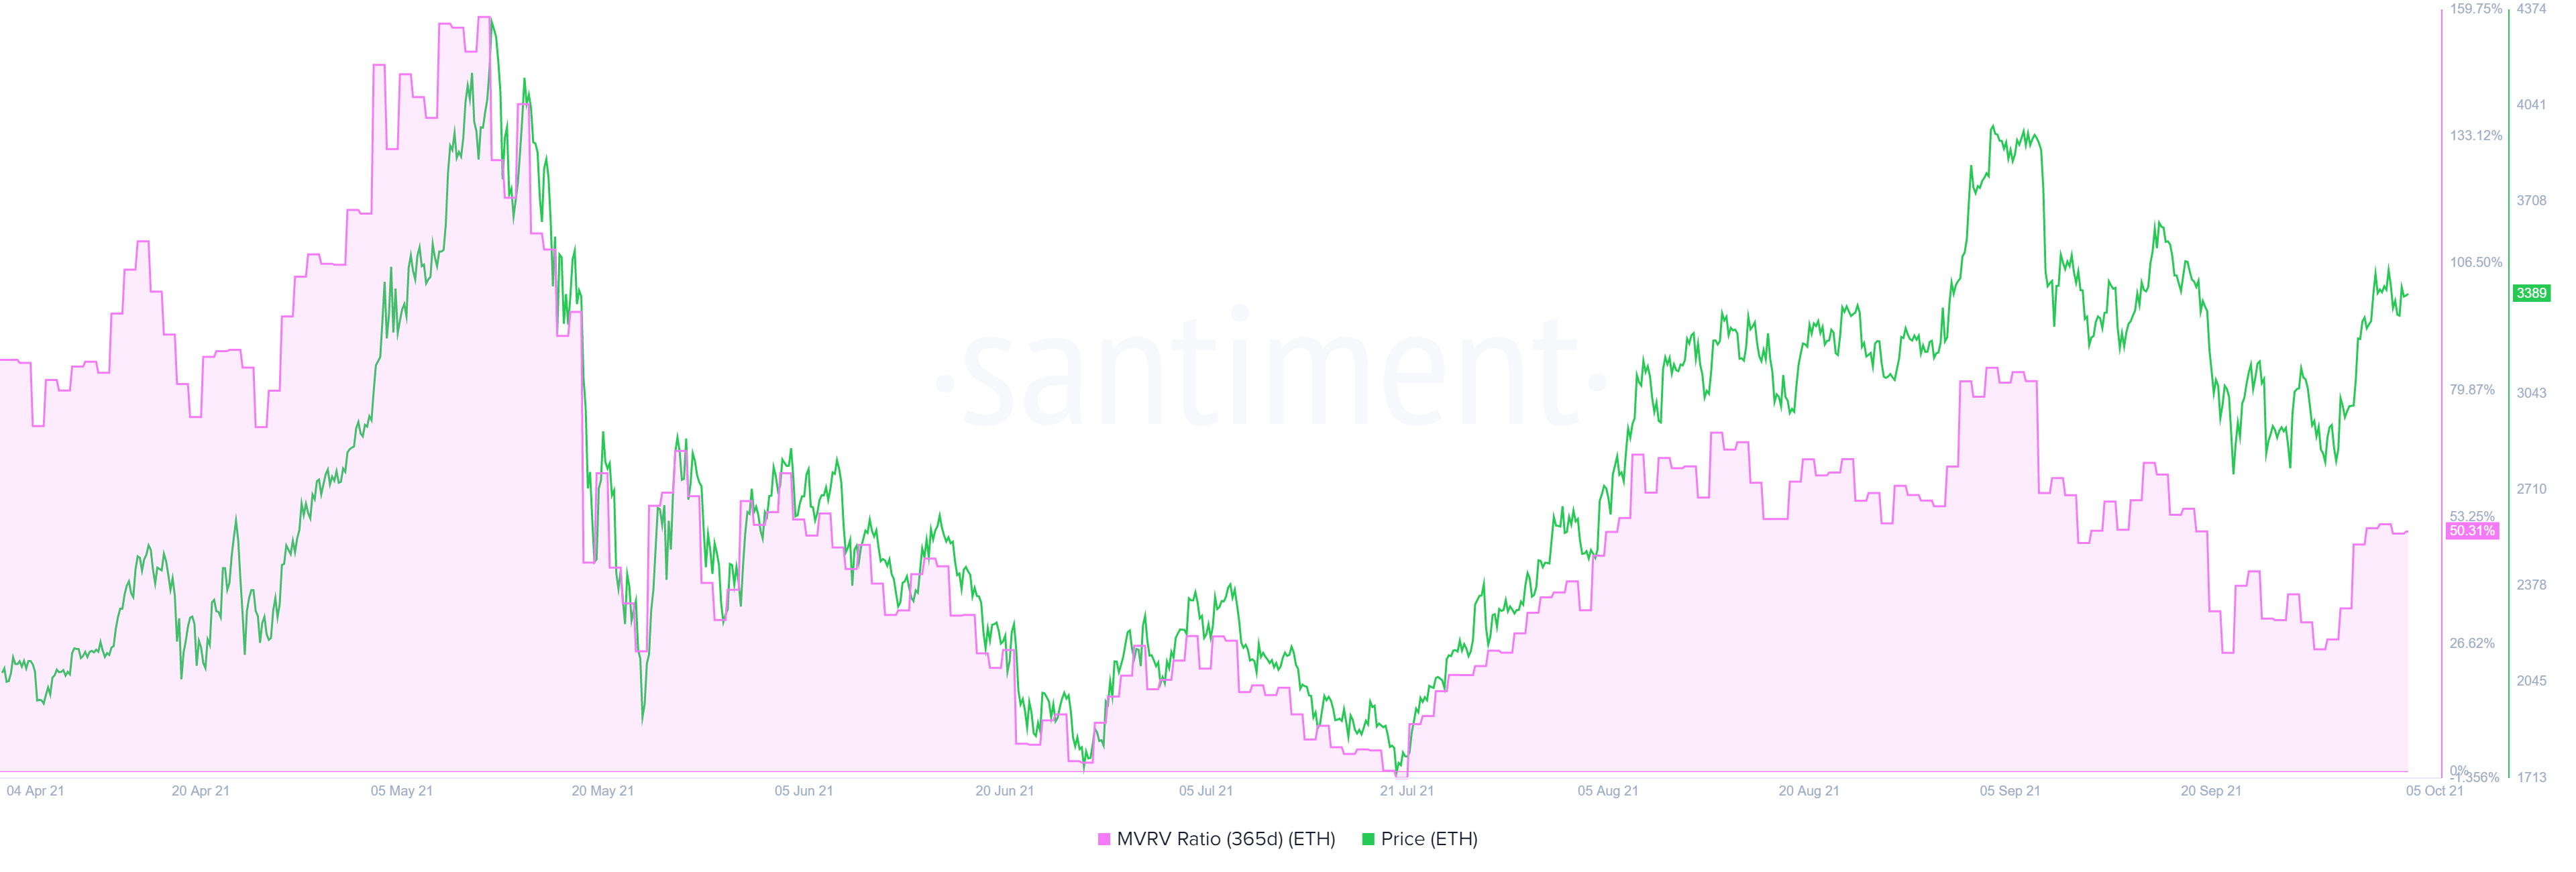
ETH 365-day MVRV chart
The supply of ETH on exchanges has risen by 170,000 over the past week, indicating that investors might be rushing to centralized entities to book profit, further adding credence to the short-term bearish outlook.
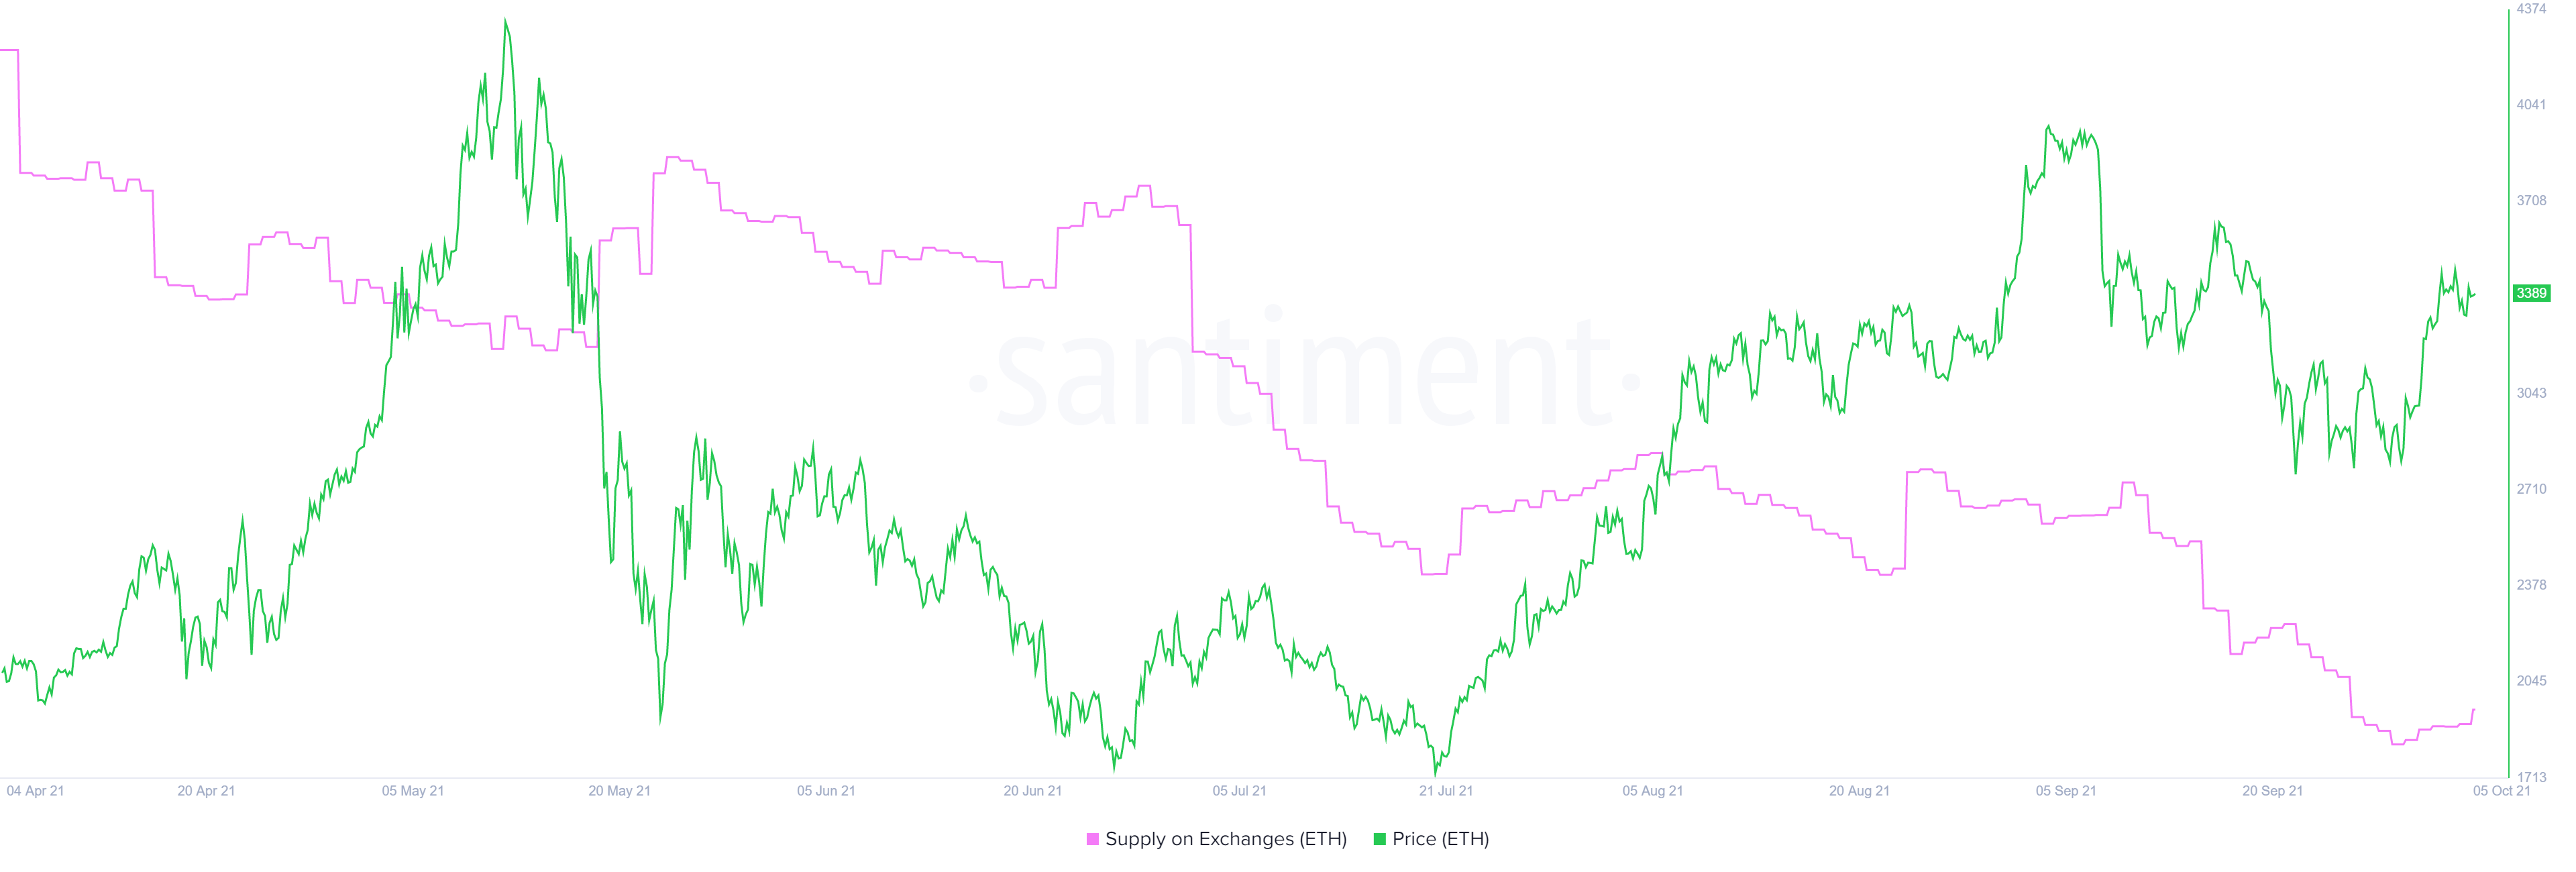
ETH supply on exchanges
Referring to the Supply Shock on-chain metric, Willy Woo, a popular on-chain analyst, mentioned in his recent newsletter,
Ethereum’s fundamental demand and supply has not been climbing as much compared to Bitcoin.
He also adds that this is the region of historical strength, further indicating that the long-term outlook for both BTC and ETH remains bullish.
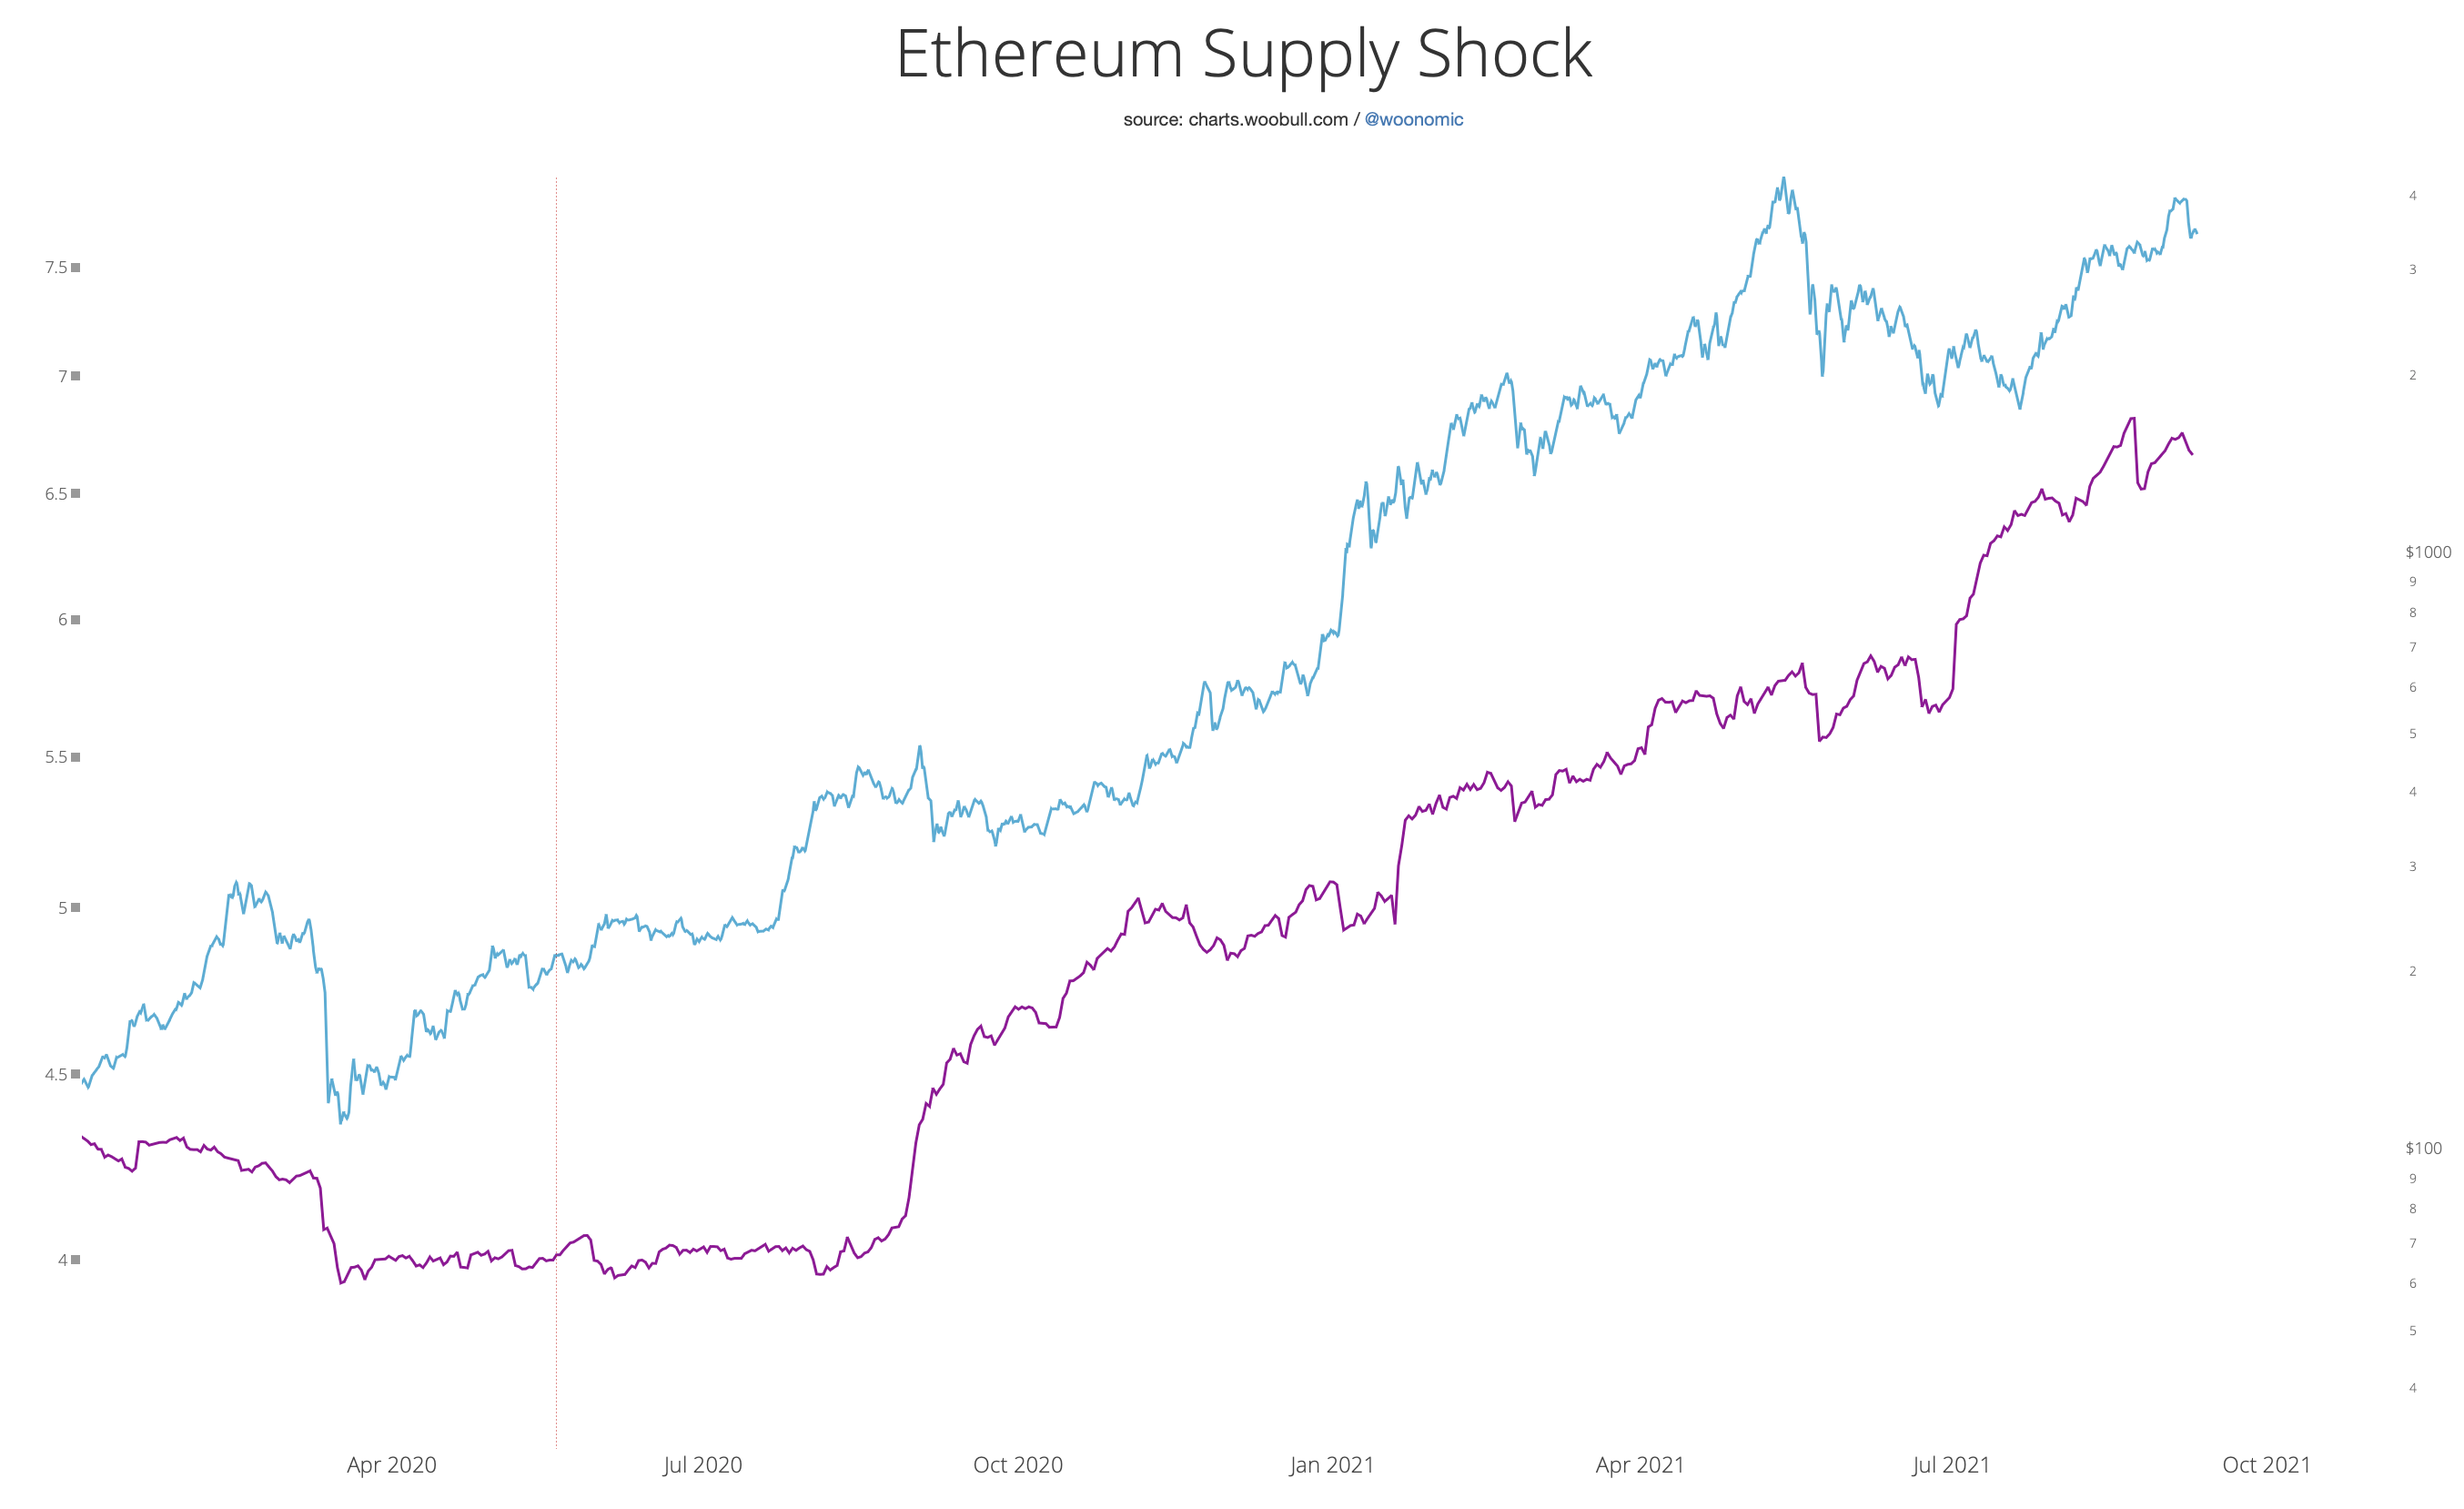
ETH, BTC supply shock chart
If Ethereum price drops below $2,765 and produces a decisive close below it, it would create a lower low, invalidating the bullish thesis. In this case, ETH might bounce off the demand zone, ranging from $2,442 to $2,605, and give the uptrend another shot.
Author

Akash Girimath
FXStreet
Akash Girimath is a Mechanical Engineer interested in the chaos of the financial markets. Trying to make sense of this convoluted yet fascinating space, he switched his engineering job to become a crypto reporter and analyst.