Top 3 Price Prediction Bitcoin, Ethereum, XRP: Crypto bloodbath likely to continue until late March
- Bitcoin price action displays bearish continuation if bulls fail to support BTC.
- Ethereum price falls below two critical support levels, confirming a likely sell-off.
- XRP price hits a major resistance cluster with sellers likey taking control.

Bitcoin price continues to slide south, with warning signs indicating a major break lower is increasingly probable. Ethereum price confirms a likely resumption of selling pressure. XRP price hangs by a thread and is positioned for another major swing lower.
Bitcoin price hints at bearish continuation amidst global uncertainty
Bitcoin price action is a victim of broader, global risk aversion due to the ongoing Russian invasion of Ukraine. As a result, commodity, equity, foreign currency, and cryptocurrency markets have all experienced massive price swings. As the riskiest of risk-on assets, Bitcoin and the rest of the cryptocurrency market are particularly affected by any risk-on avoidance.
Bitcoin is nearing a make or break point from a price action perspective. BTC confirmed an Ideal Bearish Ichimoku Breakout on Saturday, creating the first confirmed entry of this type since December 4, 2021. Typically, this type of short entry triggers massive short interest and subsequent selling pressure. However, bears have been unable or unwilling to press BTC lower.
The only support level remaining for Bitcoin price on its daily chart is the bottom of the current bear flag at $38,000. If $38,000 fails to hold as support, Bitcoin price is likely to move towards the next Fibonacci expansion level between $30,000 and $30,500.
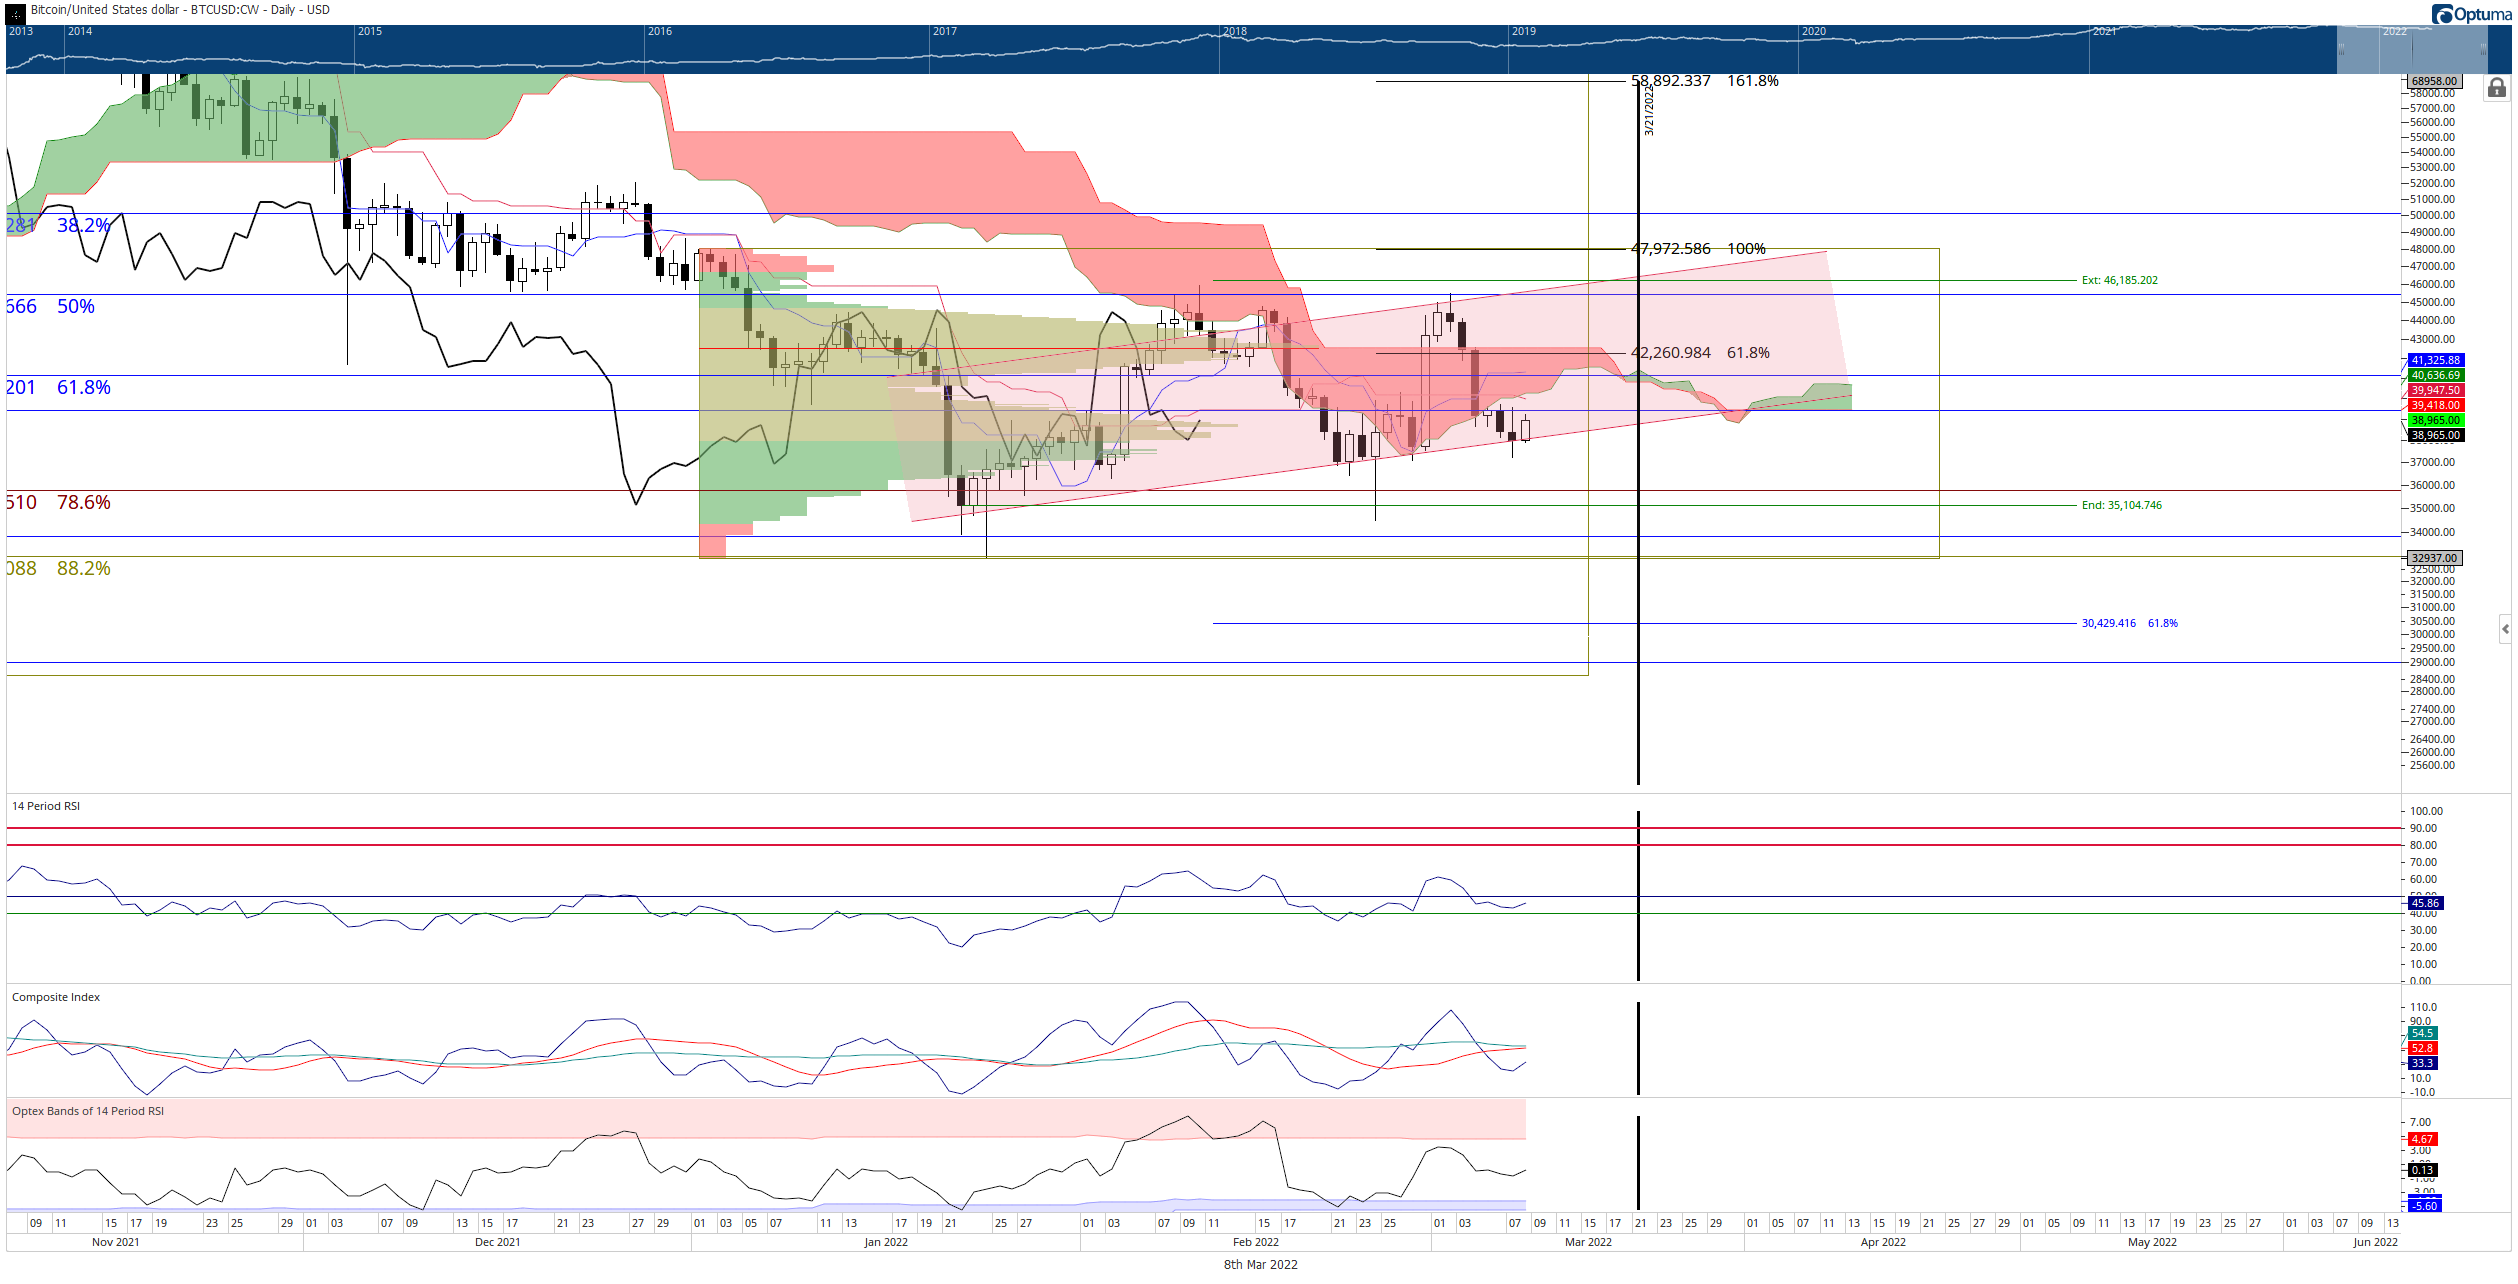
BTC/USD Daily Ichimoku Kinko Hyo Chart
However, the important Gann Seasonal Date of March 21 is coming up. Historically, when Bitcoin price is trading at a swing high or low around March 21, massive long trending moves begin. Given the current time cycles coinciding with the downtrend, a bullish reversal is increasingly likely near the end of March.
Ethereum price may nosedive towards $1,800
Ethereum price confirmed and Ideal Bearish Ichimoku Breakout last Friday, with a close below the Ichimoku Cloud. Bears were initially unable to push ETH lower due to the shared support zone at $2,570 – the 61.8% Fibonacci retracement and the bottom trendline of a bear flag. The Fibonacci retracement is derived from the all-time high to the low of the strong bar from the July 2021 to November 2021 rally.
Sunday’s close then confirmed a breakout below the bear flag and the 61.8% Fibonacci retracement. During Monday’s intraday trading, bulls had attempted to return Ethereum price inside the bear flag but failed.
The same attempt to return Ethereum price inside the bear flag happened today. Sellers were able to push Ethereum price to a close below the crucial 61.8% Fibonacci retracement on Monday, with buyers attempting to rally ETH back above that crucial level on Tuesday. However, as ETH approached the 2022 Volume Point of Control and the bearish pennant, selling resumed in earnest.
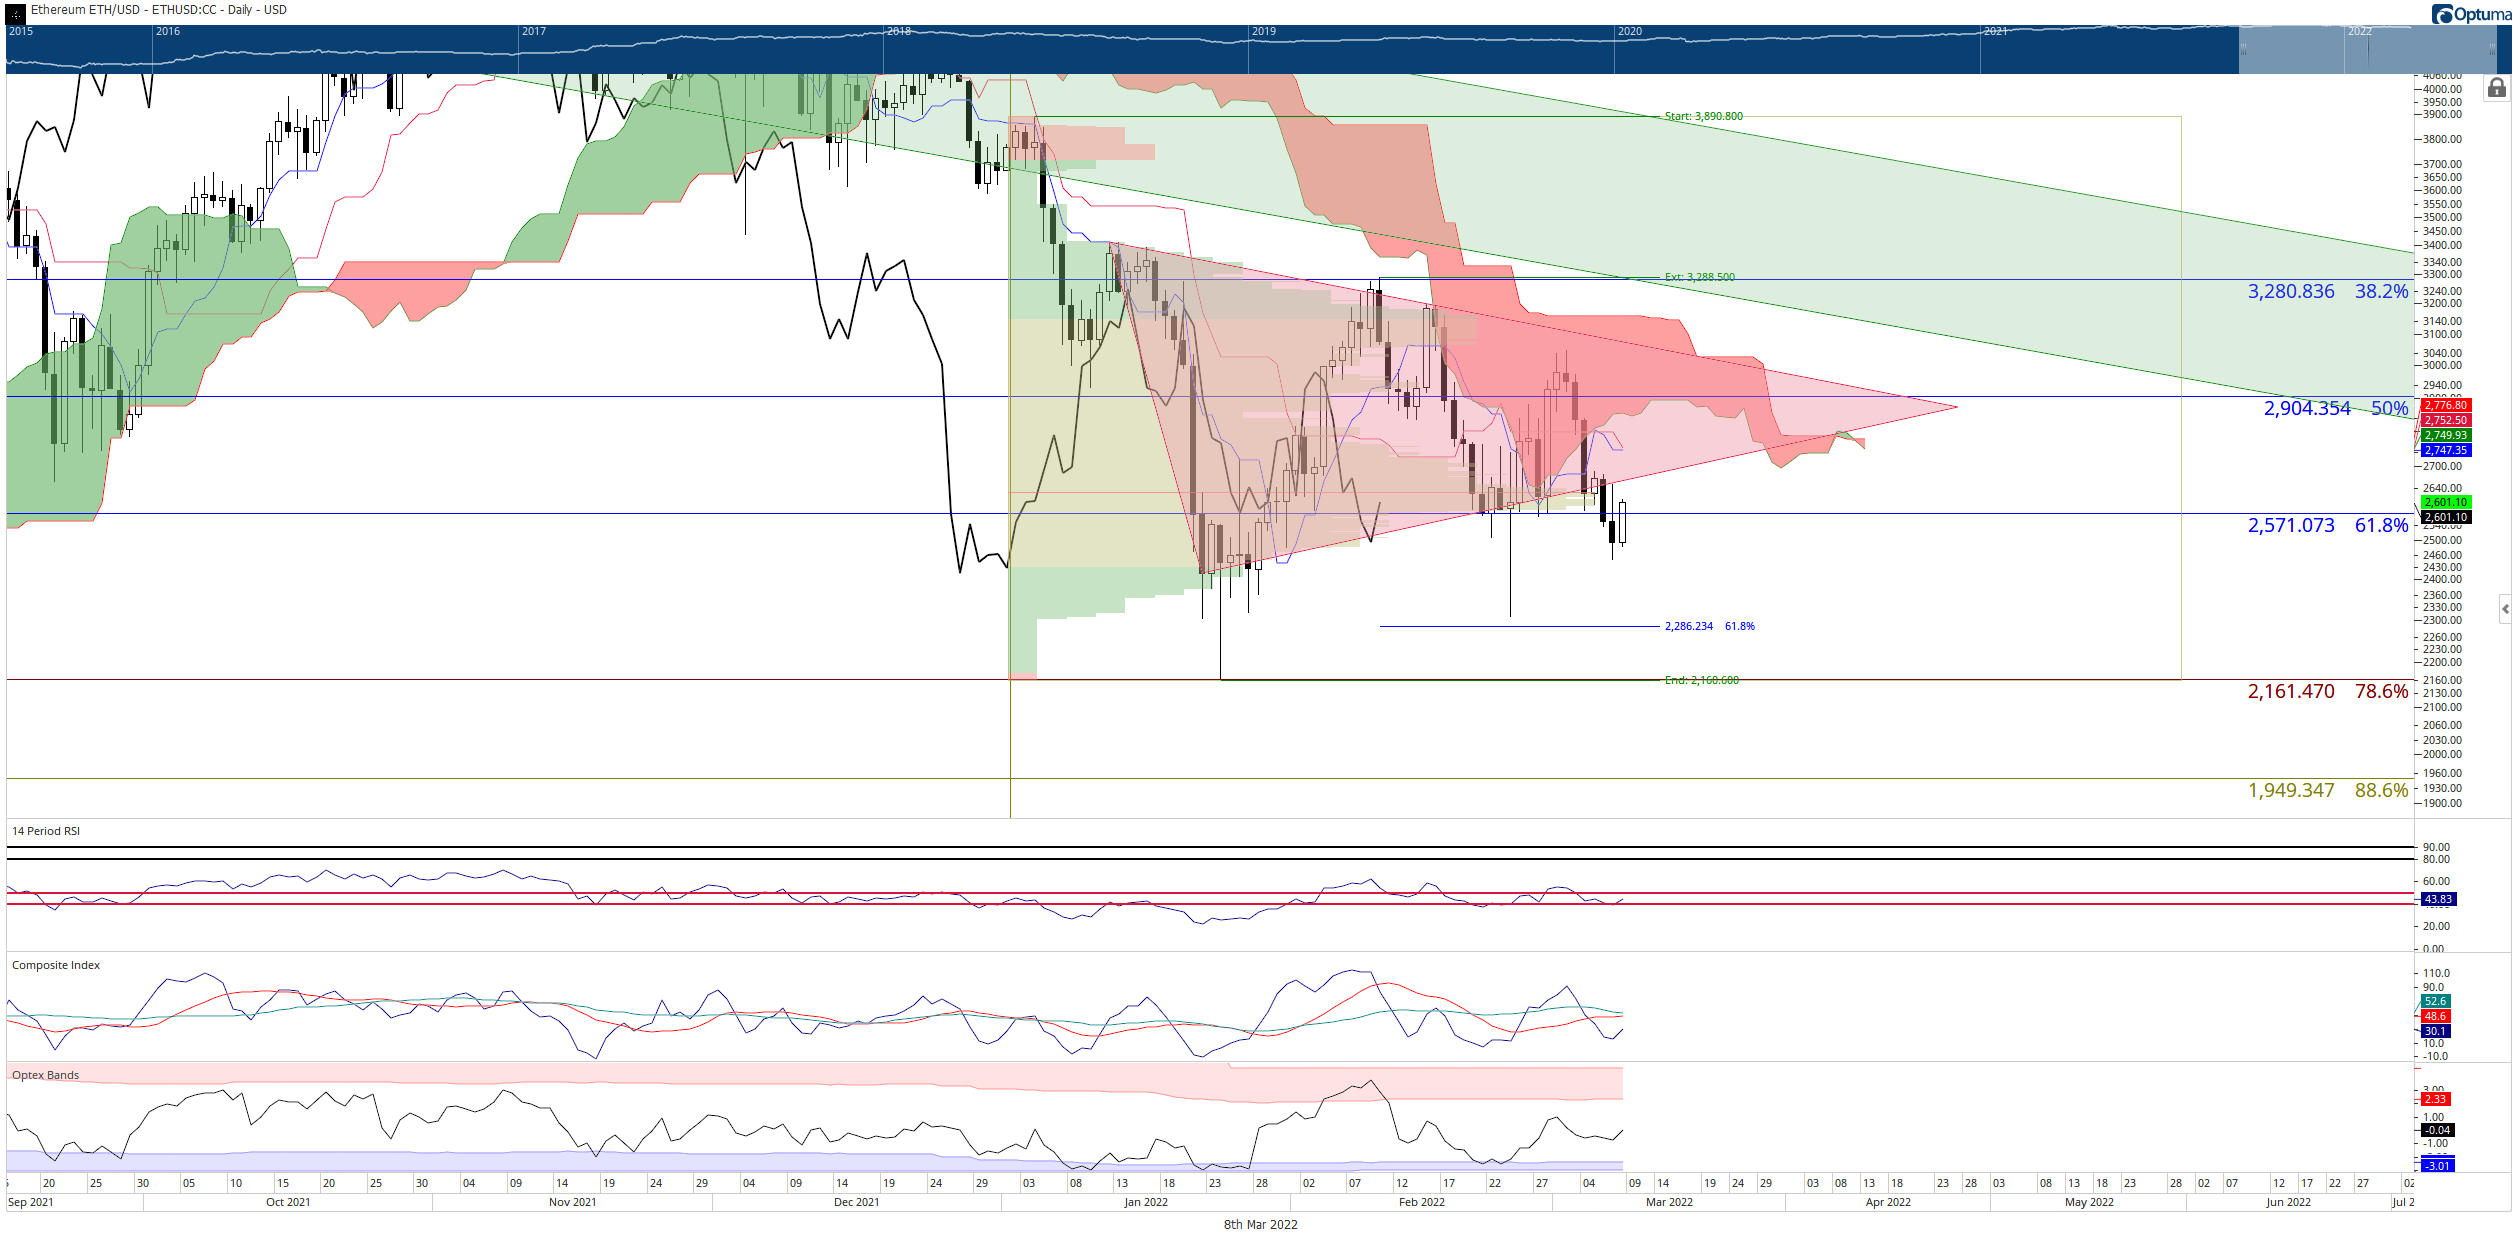
ETH/USD Daily Ichimoku Kinko Hyo Chart
The initial target for bears is the 100% Fibonacci expansion at $1,825 – but sellers will likely get halted at the bottom of the weekly Ichimoku Cloud (no shown) at $2,300. The bottom of the weekly Ichimoku Cloud has been a primary support level for Ethereum price and has yet to break as support.
Upside potential for Ethereum is likely limited to the 50% Fibonacci retracement and bottom of the Ichimoku Cloud (Senkou Span A) at $2,900 for the week.
XRP price fails to return inside the Ichimoku Cloud, bears to take over and push XRP to $0.50
XRP price completed all the required criteria for an Ideal Bearish Ichimoku Breakout on its daily chart on Sunday. There was some hope that bulls might be able to stave off any further selling on Monday when buyers pushed XRP back inside the Ichimoku Cloud and above the Tenkan-Sen – but that hope was short-lived. The subsequent rejection likely confirms that some further selling pressure for XRP is to commence soon.
The first projected target for short-sellers is likely the logarithmic 50% Fibonacci retracement of the most recent major swing high of $1.96 to the low of the weekly strong bar of $0.22 – which is at $0.64. If $0.64 fails as support, then the next support level for XRP price doesn’t appear until the 61.8% Fibonacci retracement at $0.49.
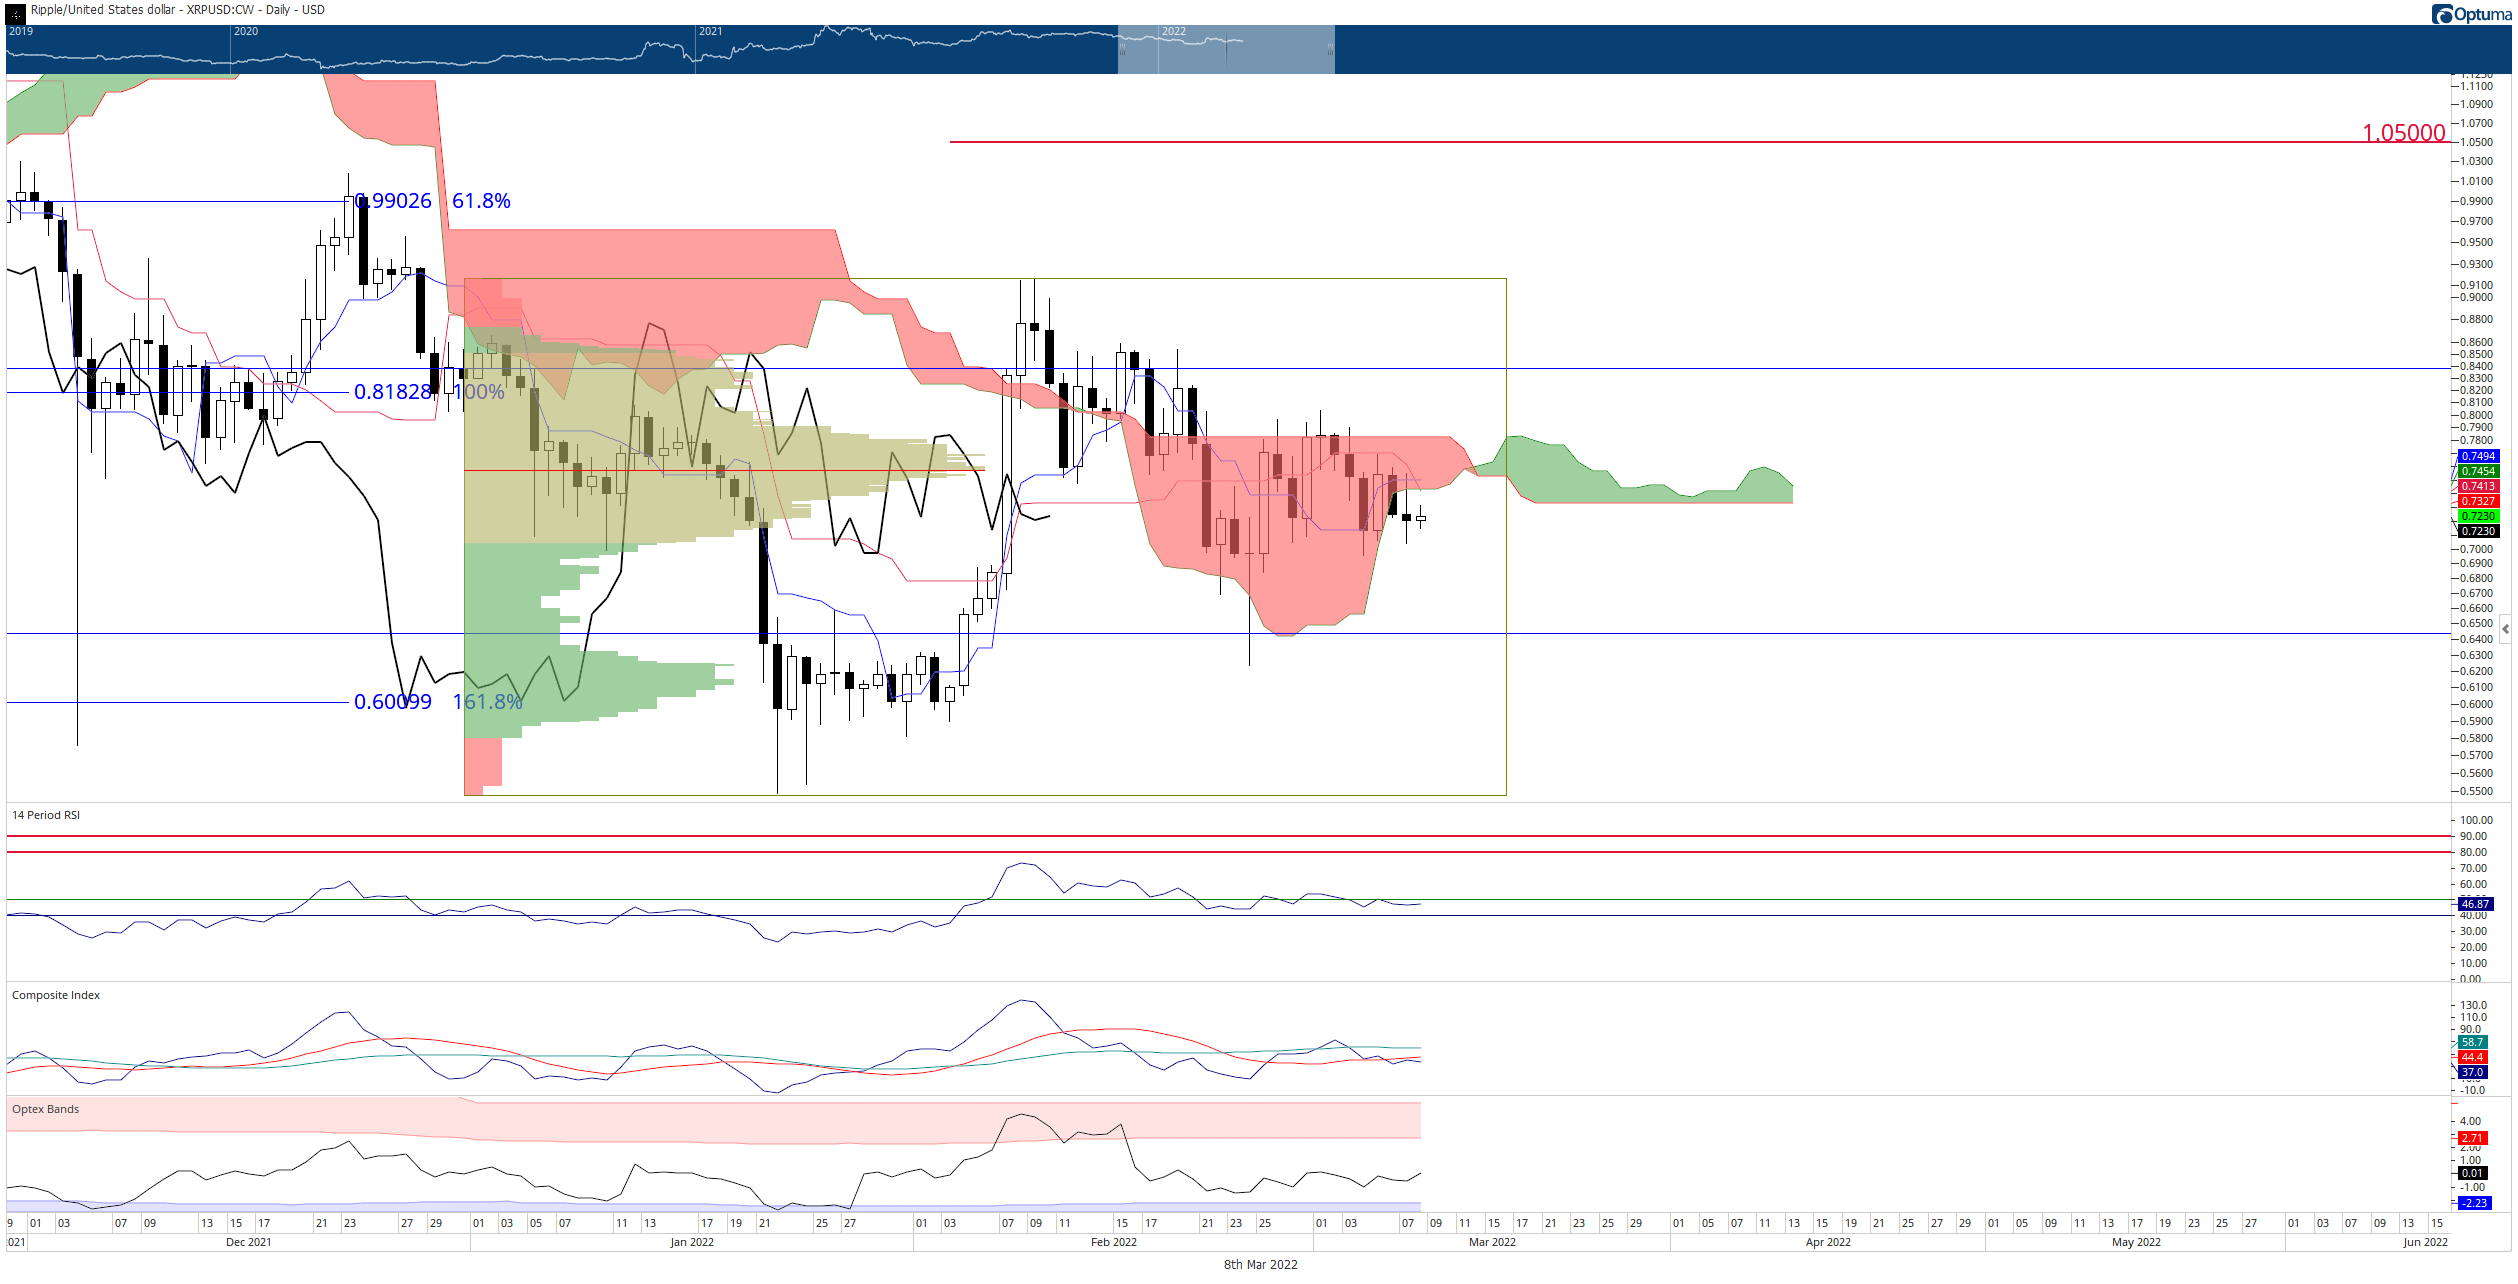
XRP/USD Daily Ichimoku Kinko Hyo Chart
If bulls want to avoid the near-term bearish outlook for XRP price, they’ll need to complete an Ideal Bullish Ichimoku Breakout. Unfortunately, that is a difficult goal for bulls to achieve because not only does XRP price need to close above the Ichimoku Cloud, the Chikou Span needs to close above the candlesticks and be in open space – a close at $0.85 is the minimum price level to confirm an Ideal Bullish Ichimoku Breakout.
Author

Jonathan Morgan
Independent Analyst
Jonathan has been working as an Independent future, forex, and cryptocurrency trader and analyst for 8 years. He also has been writing for the past 5 years.


