Top 3 Price Prediction Bitcoin, Ethereum, Ripple: XRP to outperform BTC and ETH
- Bitcoin price pushes towards new five-month highs, tests prior May 12th sell-off levels.
- Ethereum price shows a massive bullish engulfing daily candlestick developing on the Monday trade session.
- XRP price positioning for the most bullish conditions it's seen since March.

Bitcoin price is now trading at the same levels that preceded the -50% corrective move from May 12th to June 22nd. Ethereum price is currently forming one of the most sought-after bullish candlestick patterns, the bullish engulfing candlesticks pattern, while also attempting to complete an Ideal Bullish Ichimoku Breakout entry. XRP price, finally, is in a position to catch up to its peers' performance and experience its first major bullish breakout since March.
Bitcoin price less than 15% away from its all-time highs
Bitcoin price continues its rally that began with the significant bullish breakout above the Cloud on October 4th. Since the beginning of October, Bitcoin has gained 30%. In addition to the significant rally, it has nullified all recent hidden bearish divergences, confirming a sustained move. New all-time highs are very likely if the momentum continues.
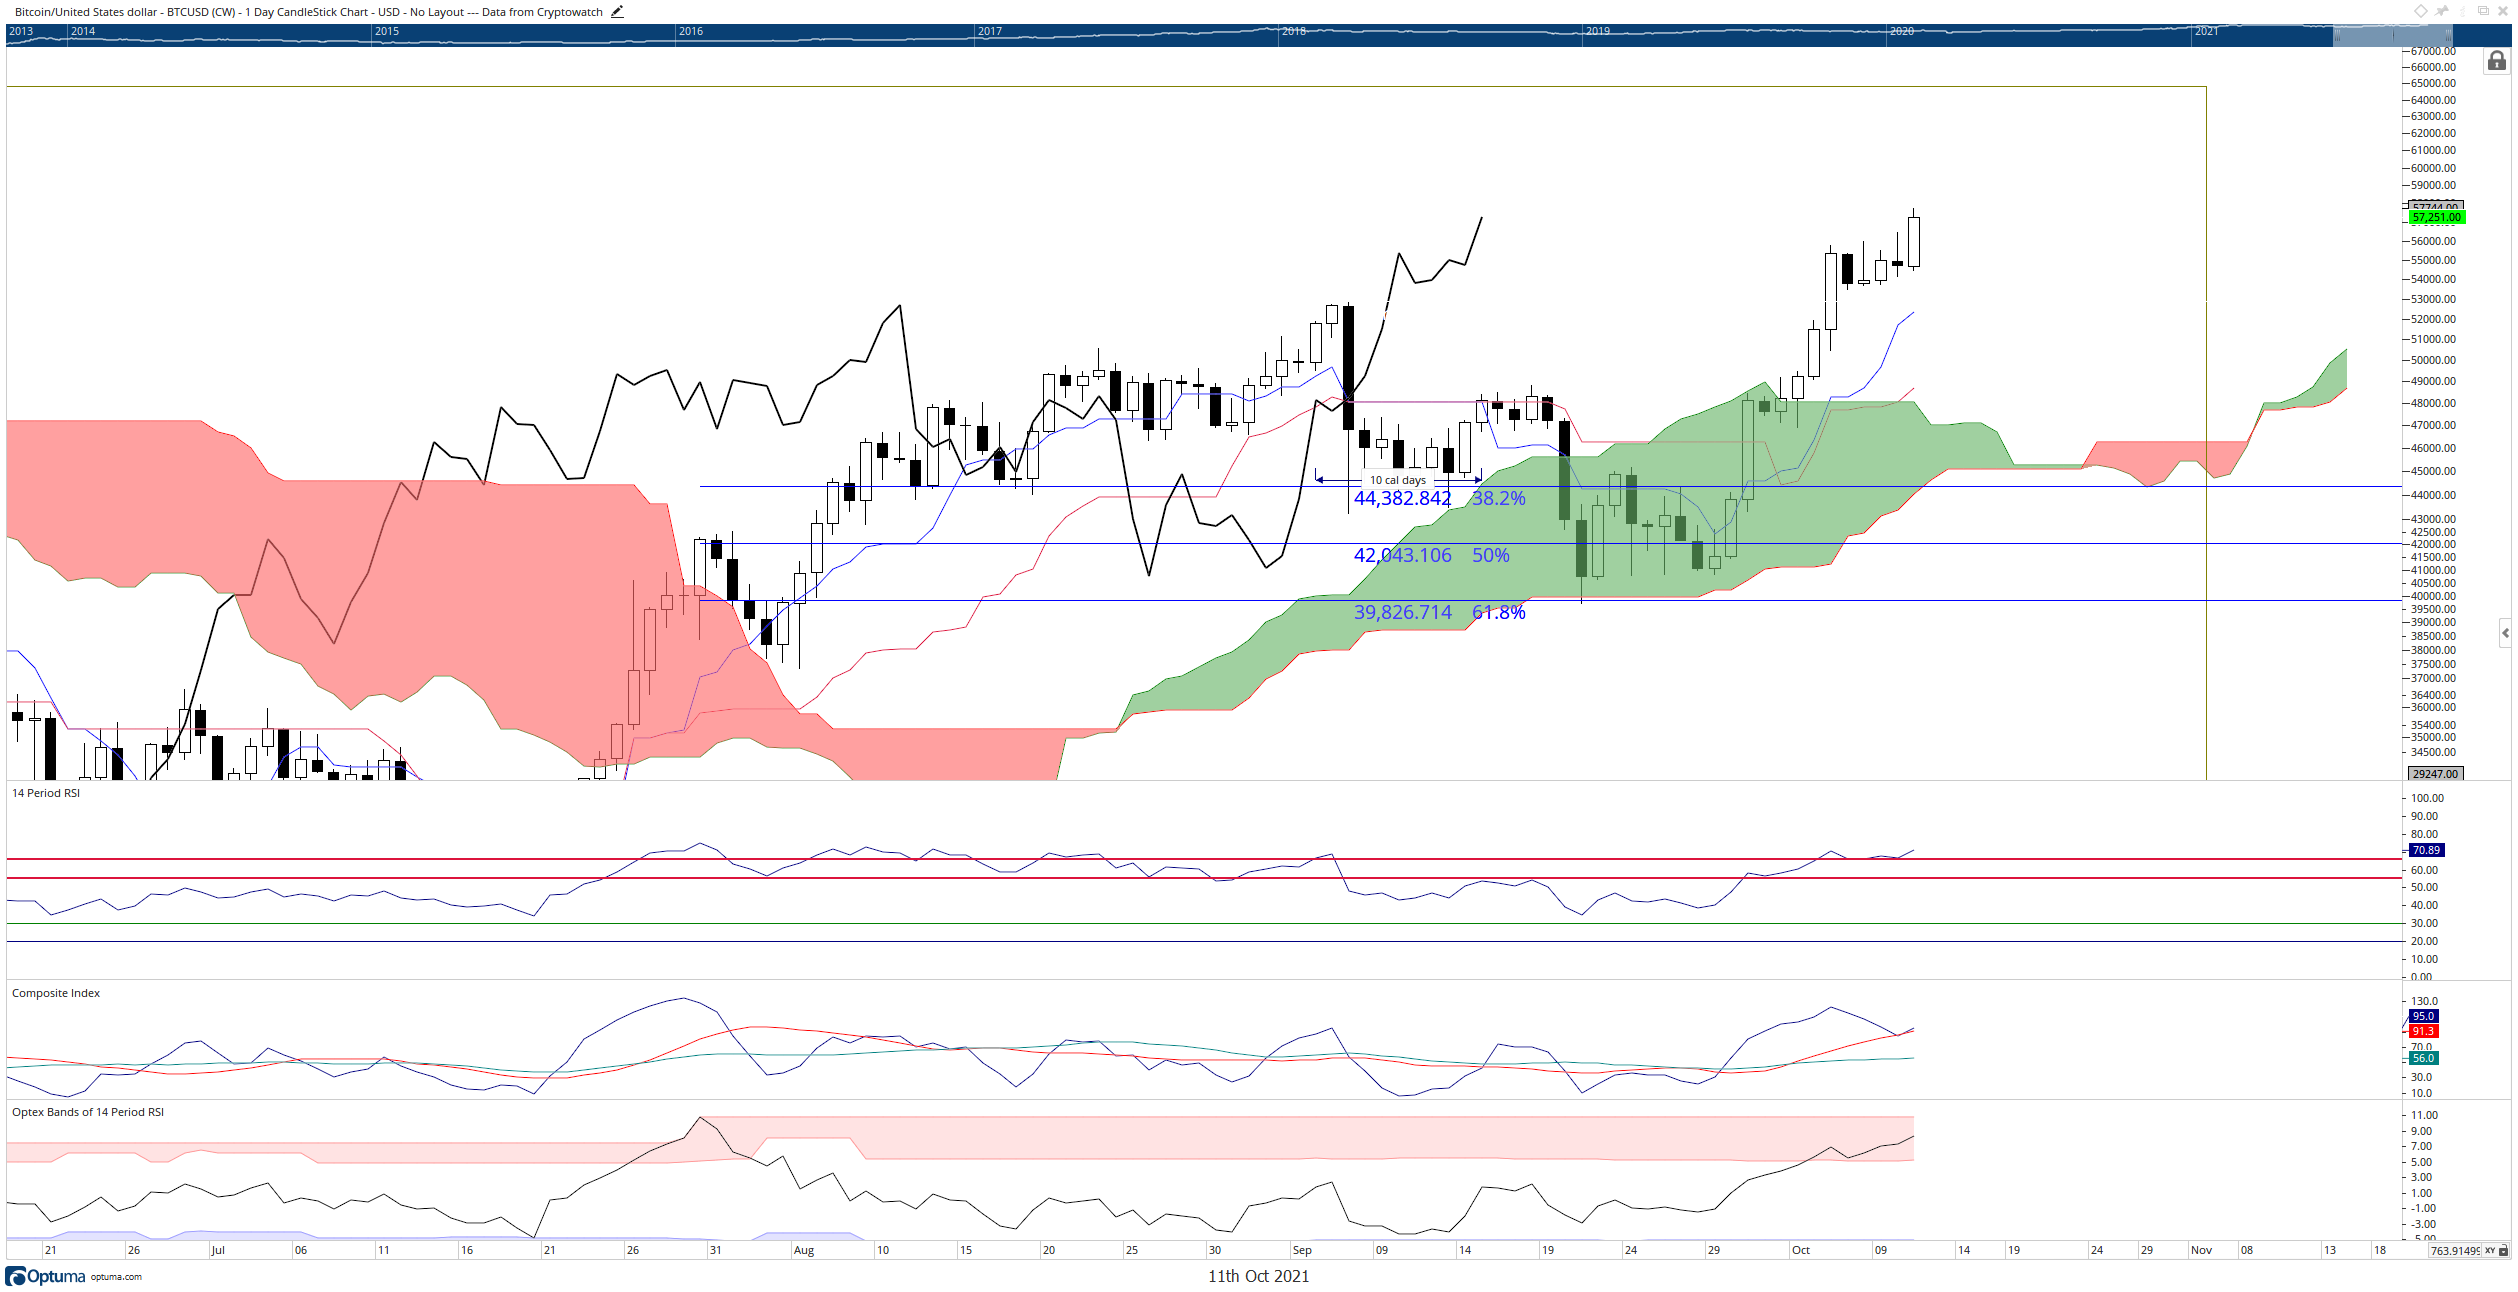
BTC/USD Daily Ichimoku Chart
There may be a pause in the really around October 20th when the next Kumo Twist rears its ugly head. If Bitcoin continues to push higher with the same momentum near the October 20th date, then Bitcoin price could experience a swift corrective move and a return to the Tenkan-Sen or Kijun-Sen – roughly a -15% to -33% drop. But that pullback will likely be a regular and fast corrective move. Near-term support is the Tenkan-Sen at $52,000.
Etheruem price nears confirmation of a bullish breakout, next all-time high target near $6,200
Ethereum price currently shows a rare and overwhelmingly bullish breakout setup. First, the Ideal Bullish Ichimoku Breakout entry is complete and confirmed if Ethereum can close the daily candlestick at or above $3,580. Second, the candlestick pattern itself, a bullish engulfing candlestick, is one of the strongest bullish candlesticks in Japanese analysis. It's rare even to have these two conditions play out simultaneously, and it should represent the beginning of an explosive move higher over the next couple of trade days.
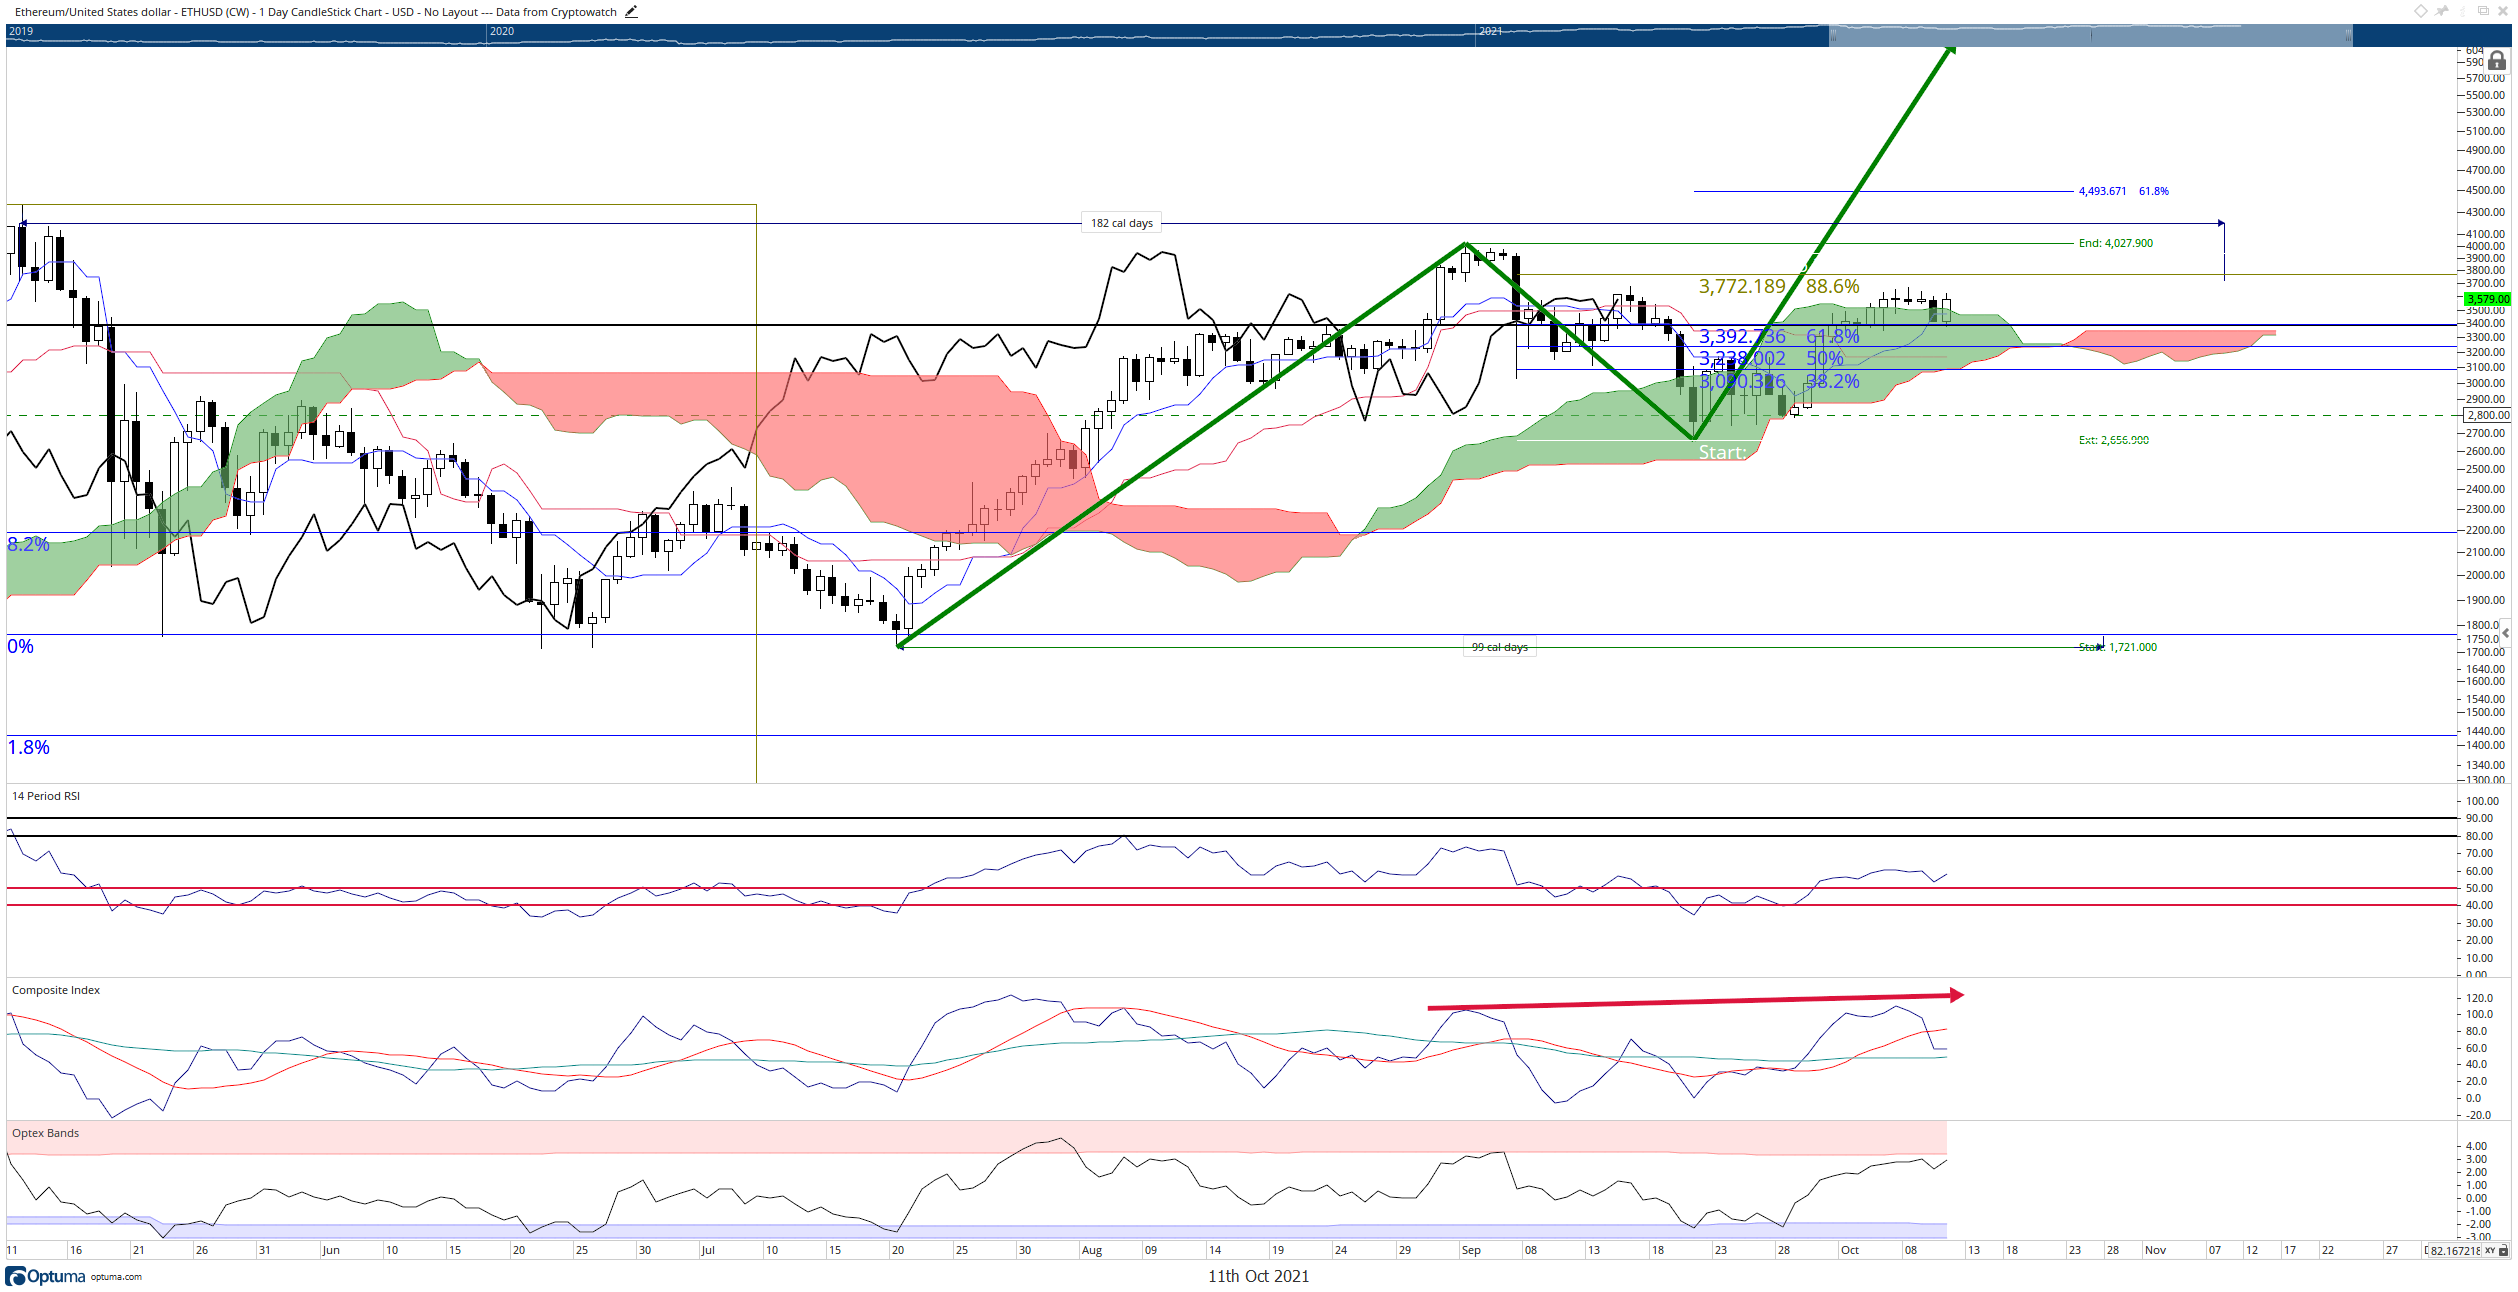
ETH/USD Daily Ichimoku Chart
Bulls must avoid tunnel vision, however. As bullish as Ethereum price action is, the current condition would be the perfect bull trap. The Relative Strength Index remains in a position that provides substantial weight to any downside pressure. Buyers must confirm the breakout and sustain it to eliminate any remaining bearish warning signals.
XRP finally nears a bullish breakout
XRP price has undoubtedly been the laggard of the three cryptocurrencies discussed in this article. Bitcoin was the first rally, now Ethereum is poised to be next, and finally, XRP may have its day. There remains only one more condition on the daily Ichimoku chart for XRP to confirm an Ideal Bullish Ichimoku Breakout entry, which is close above the Cloud ($1.19). From there, XRP would be well-positioned to push to new three-year highs in the $2.50 to $3.00 value areas.
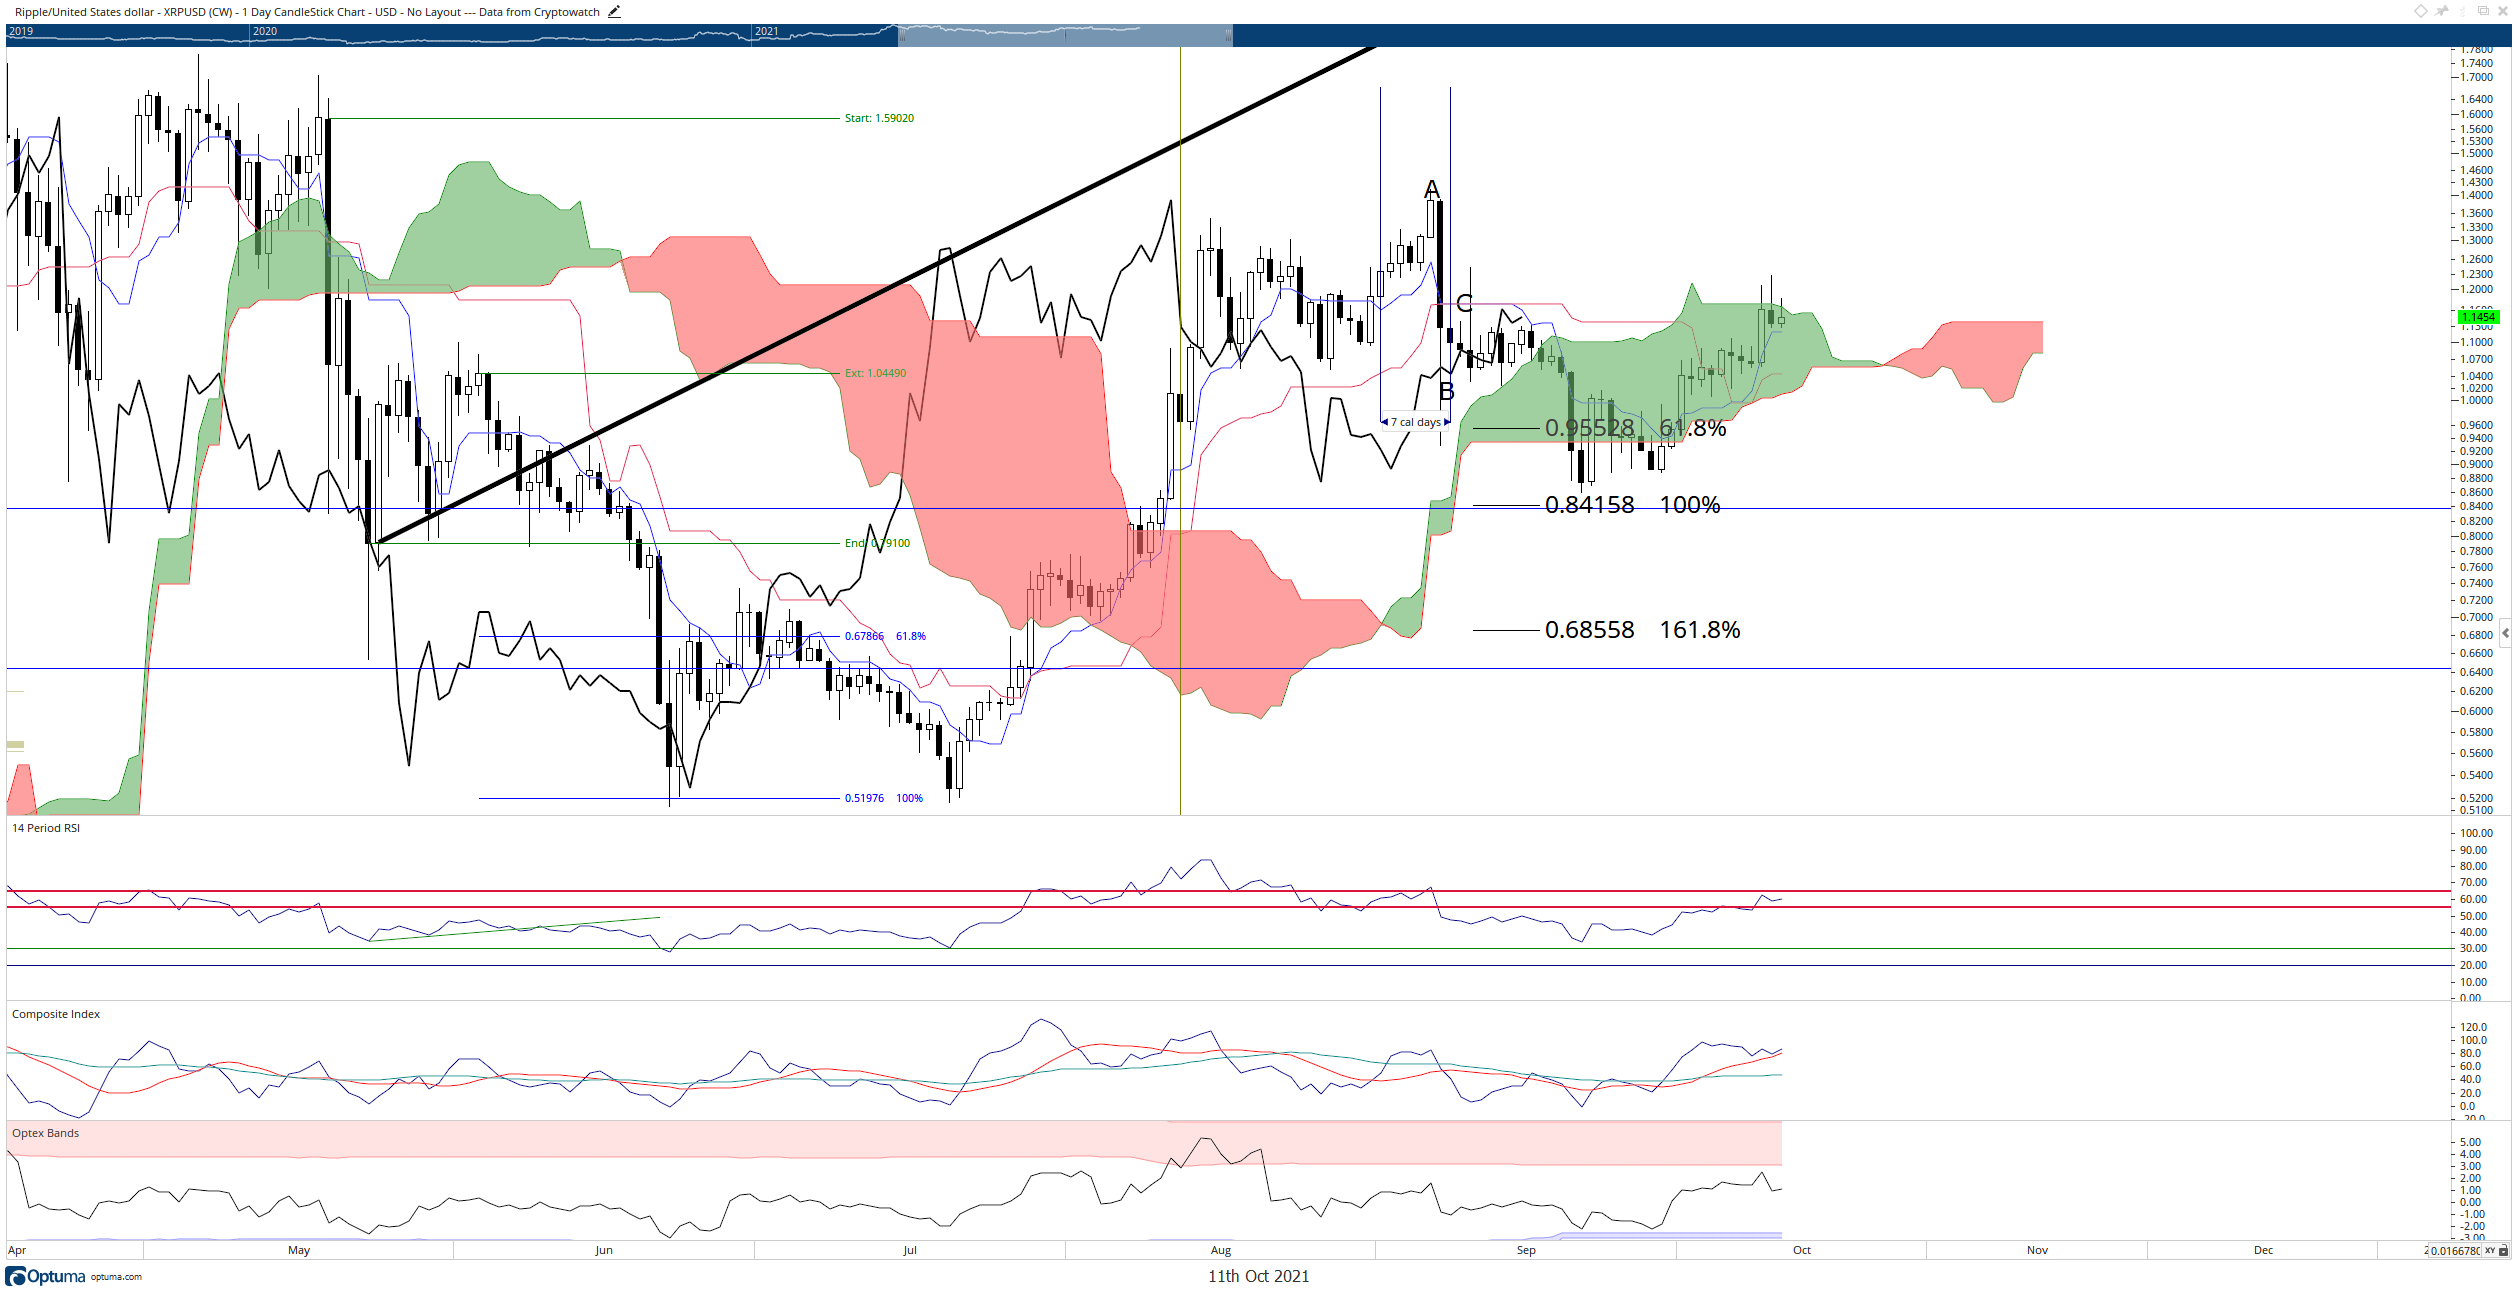
XRP/USD Daily Ichimoku Analysis
XRP bulls should watch for any intense weakness that could occur, specifically any daily close below $0.93. A close at or below $0.93 would position the Chikou Span and the current close below the Cloud and create the inverse of the Ideal Bullish Ichimoku Breakout – the Ideal Bearish Ichimoku Breakout. Sub $0.50 price levels would be very likely if that were to occur.
Author

Jonathan Morgan
Independent Analyst
Jonathan has been working as an Independent future, forex, and cryptocurrency trader and analyst for 8 years. He also has been writing for the past 5 years.


