Top 3 Price Prediction Bitcoin, Ethereum, XRP: Altcoin lag while BTC marches higher
- Bitcoin price hits $56,000 faces selling pressure during the Friday trade session.
- Ethereum price is showing signs of exhaustion, momentum slowing despite primary bullish breakout conditions.
- XRP price remains muted and mostly unresponsive compared to Bitcoin and Ethereum

Bitcoin price appears to have hit a minor top, with selling pressure pouring in during the late morning and early afternoon New York trade session. A bearish hammer candlestick pattern is developing, indicating a high is likely in. Ethereum shows some mixed behavior on its chart. Despite having an extremely bullish Ichimoku chart, buyers are not pursuing any follow-through to propel Ethereum price higher. XRP price remains in a very stagnate position.
Bitcoin price at a temporary top
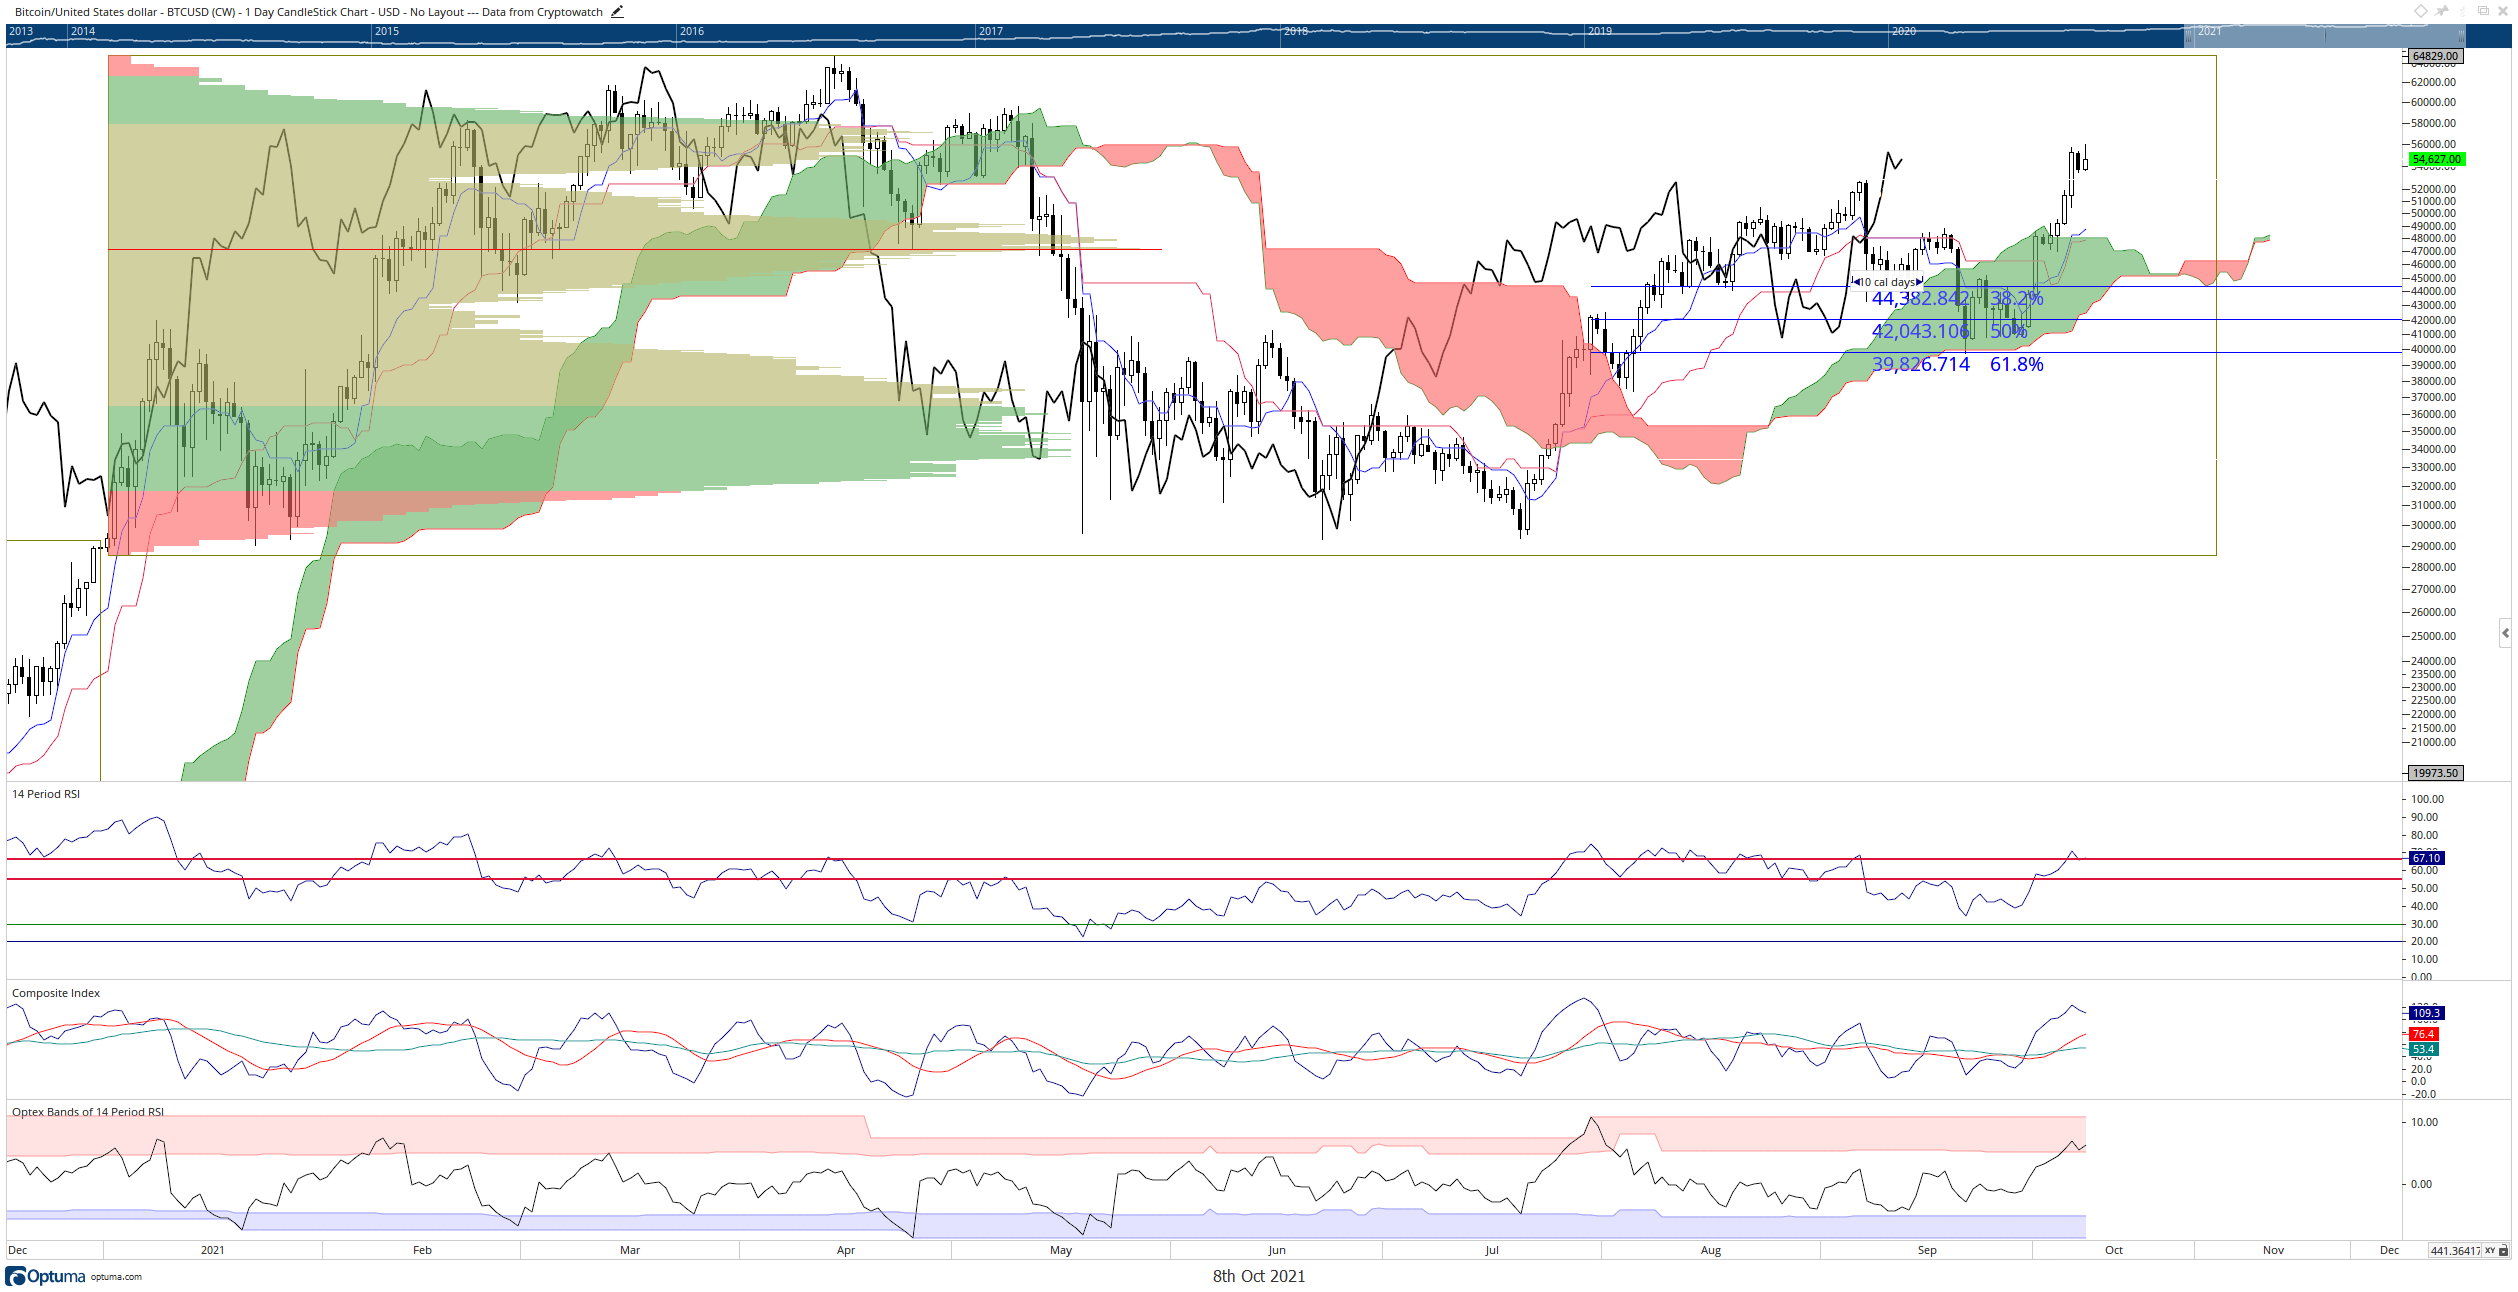
Bitcoin price has made spectacular gains since last Friday, moving higher nearly 28% in a week. However, the current daily price action looks a little top-heavy, with some selling pressure coming at the $56,000 value area. I anticipate a -13% drop from the $56,000 level to return to the Tenkan-Sen between $48,000 and $50,000. There is a substantial gap between the daily candlesticks and the Tenkan-Sen; gaps do not last long between price and the Tenkan-Sen.
BTC/USD Daily Ichimoku Chart
Additionally, the Optex Bands oscillator shows Bitcoin is trading at extremes. The Composite Index has been trading at the second-highest level since July 29th and the third-highest level since December 19th, 2020. If the Relative Strength Index returns below the 65 level, we could see a continuation move south for Bitcoin that may extend beyond $48,000.
Ethereum price needs buyers to support bullish conditions
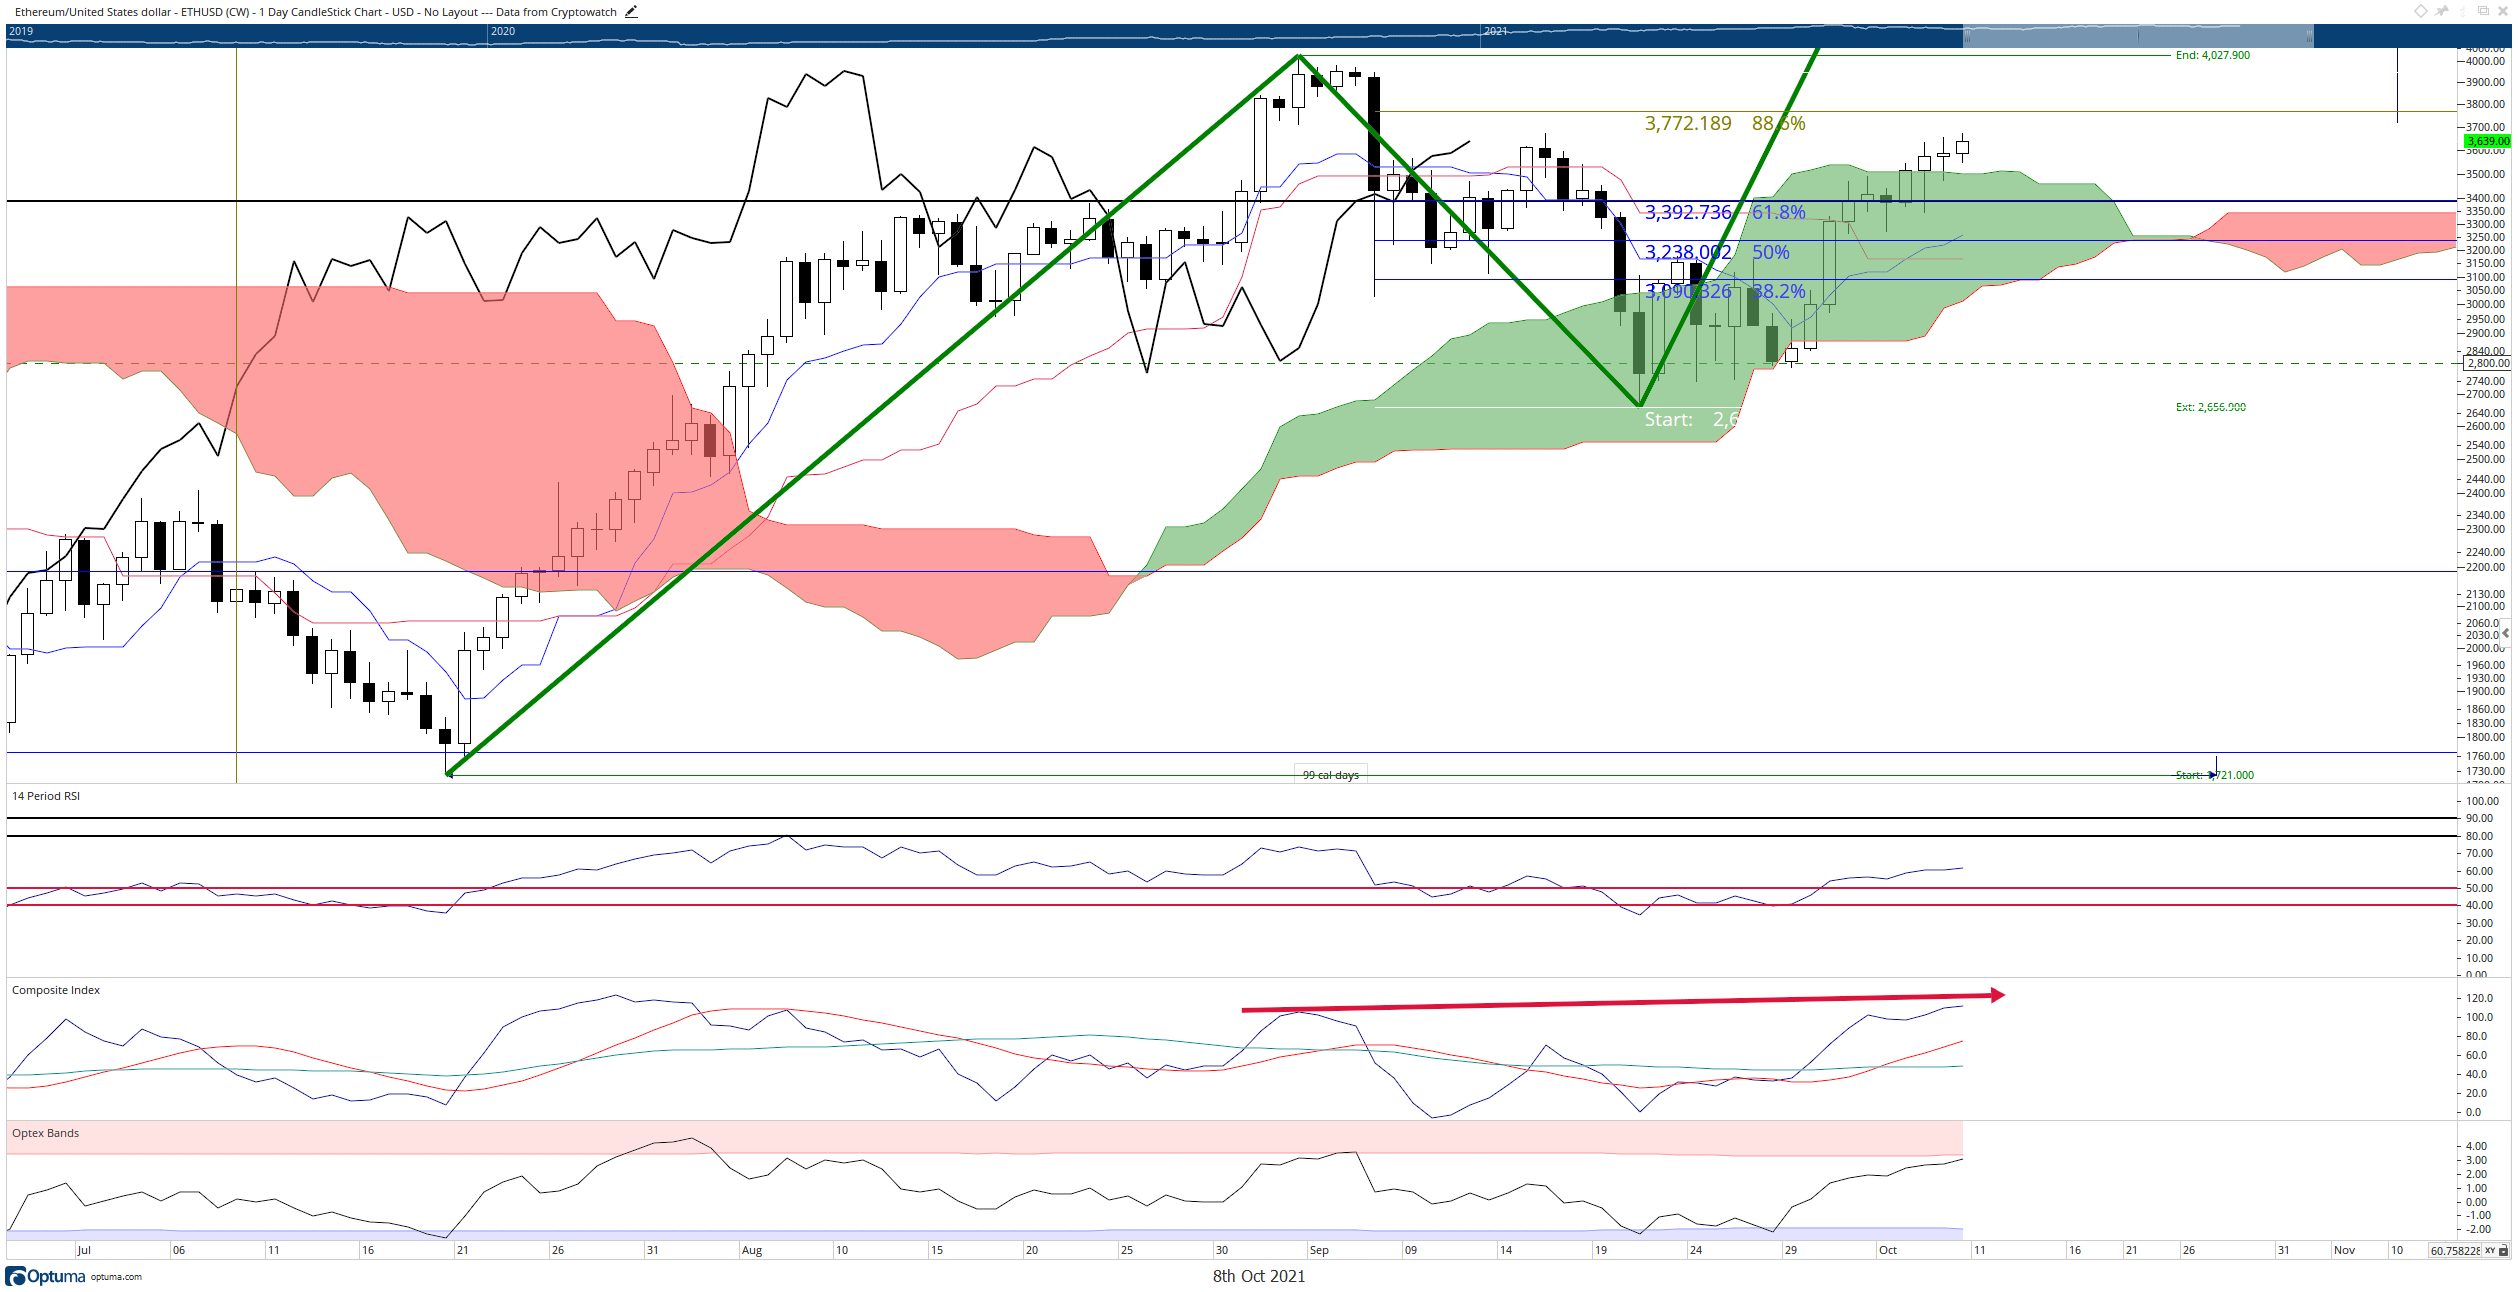
Ethereum price recently fulfilled all conditions necessary to confirm an Ideal Bullish Ichimoku Breakout pattern. Typically, significant momentum enters the market when this pattern completes, and strong buying support crashes in to rally the instrument higher. But while Ethereum has generated some higher moves above the Cloud, the response is not what one would expect to form such a bullish breakout. Warning signs exist in the oscillators that the move could be under threat of termination. The Optex Bands are at an extreme, and there is extended hidden bearish divergence in the Composite Index.
ETH/USD Daily Ichimoku Chart
Bulls should be wary of any loss of momentum and increases in selling pressure on faster time frames. If sellers take control, then bears will most likely retest the $3,000 level where the Tenkan-Sen, Kijun-Sen and 50% Fibonacci retracement line. However, if buyers continue pushing Ethereum higher and beyond the all-time high, nothing stops it from rallying to the $6,200 value area.
XRP price volatility and indecision continues, direction undetermined
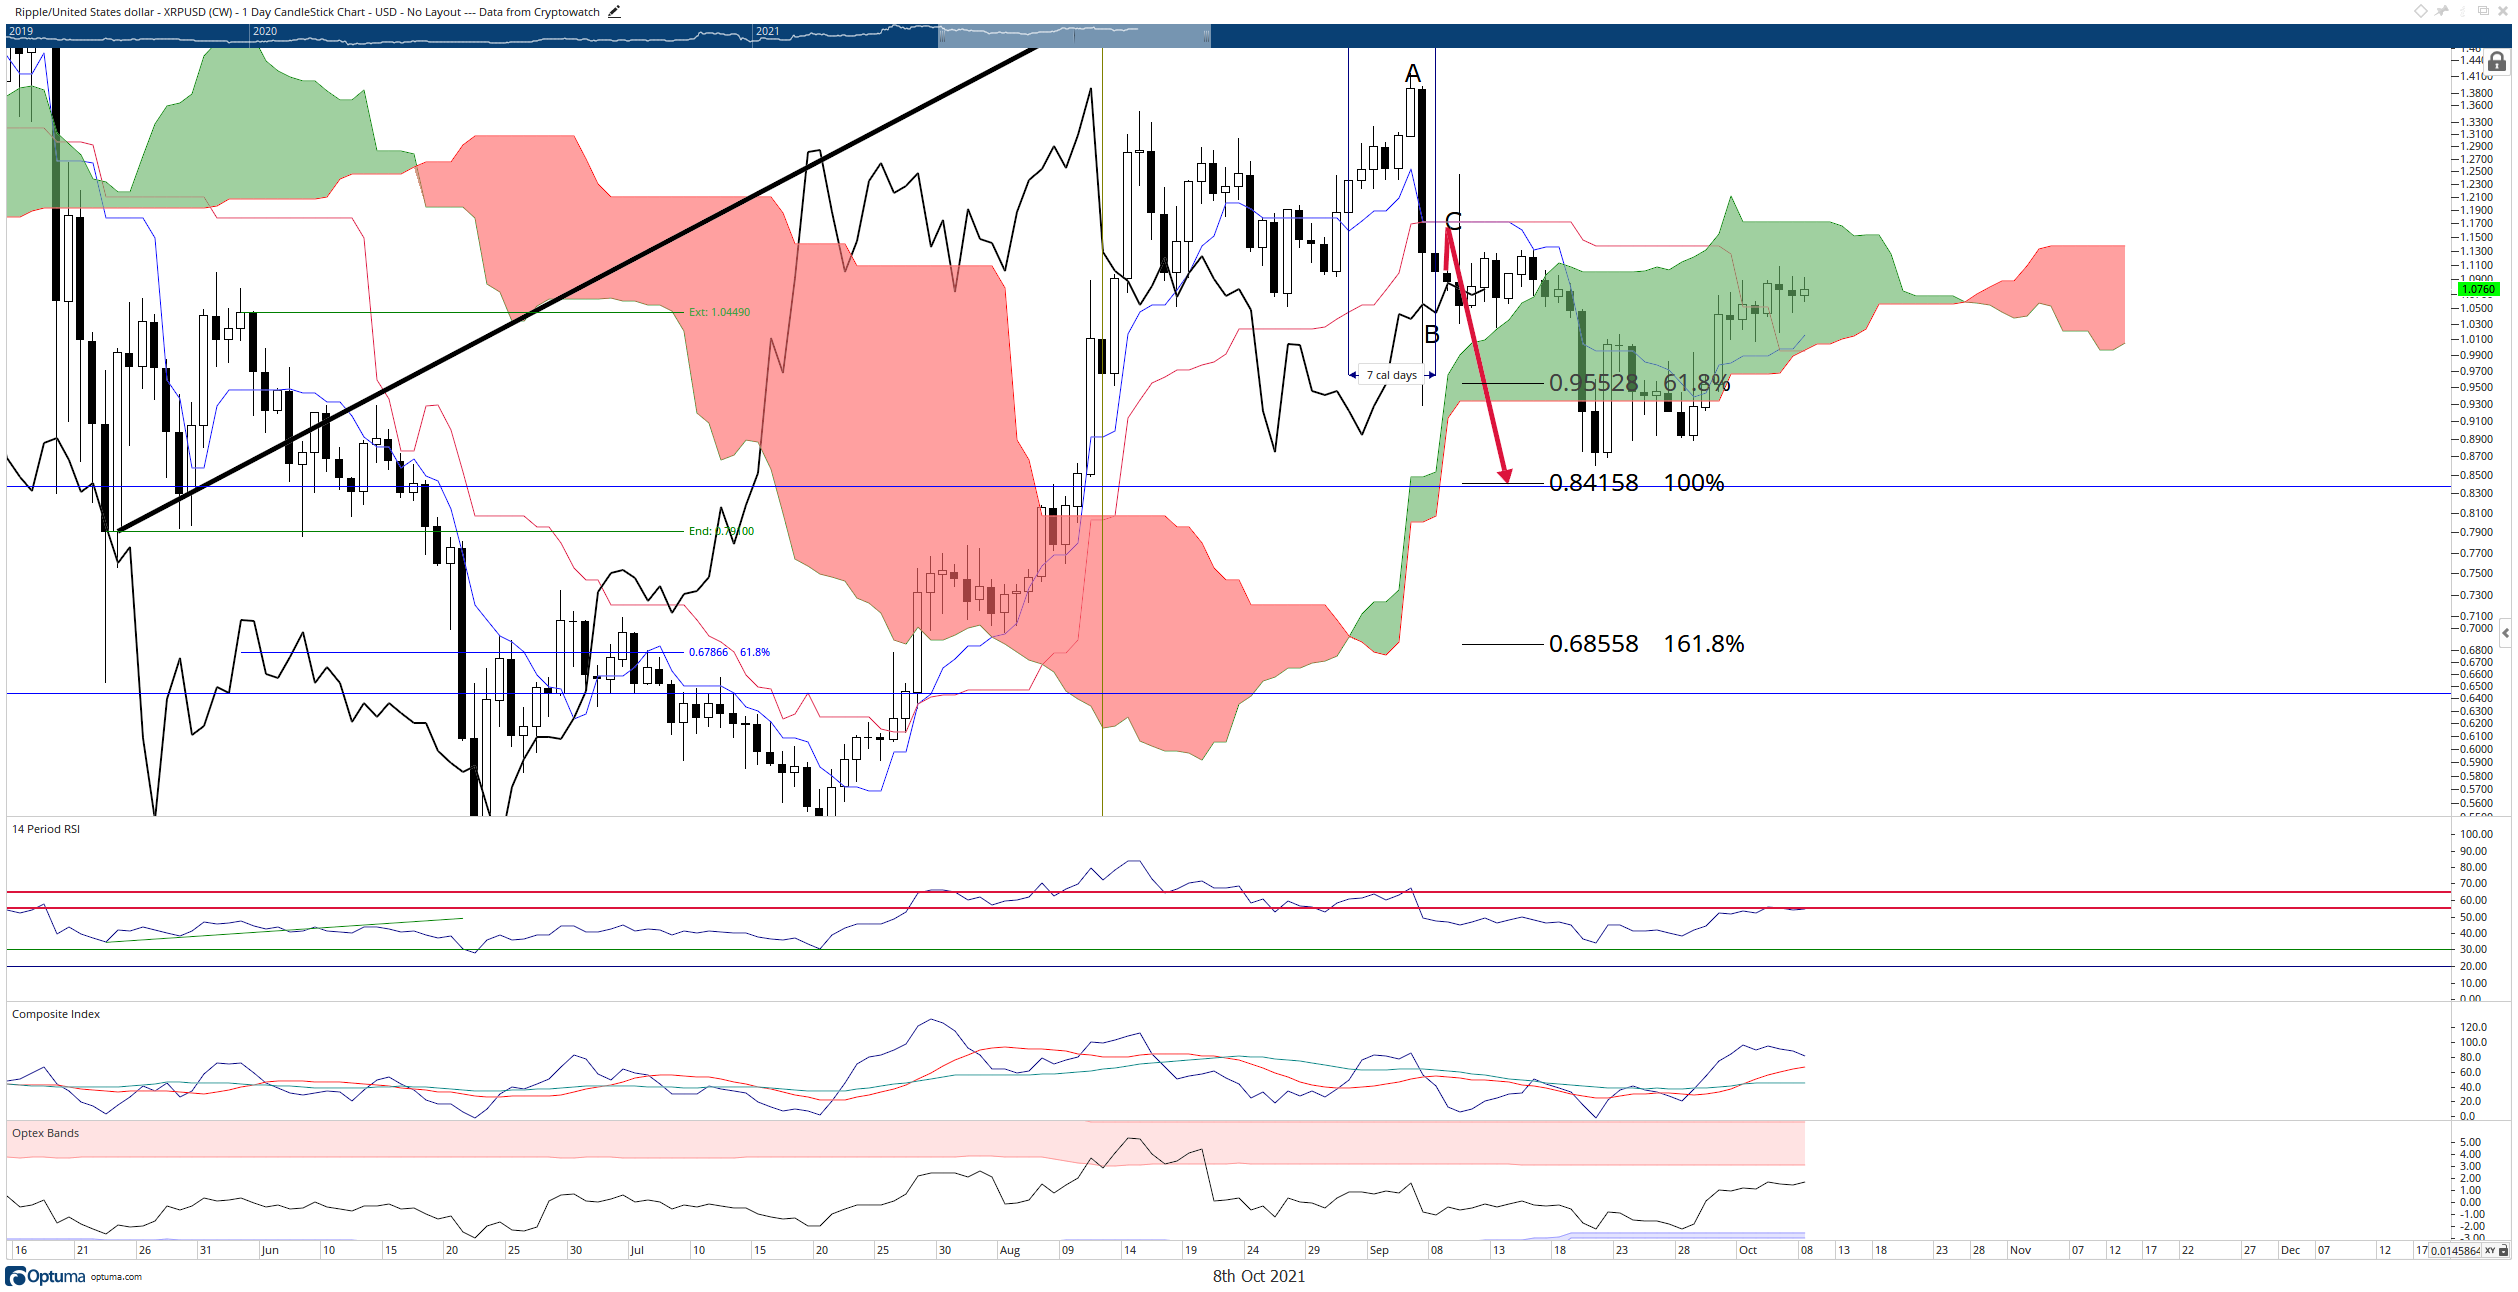
XRP price remains constricted inside the Ichimoku Cloud and continues to experience very choppy trading conditions. Buyers could be waiting for the Chikou Span to close above the candlesticks at $1.12, but XRP would still be inside the Cloud even if that even occurs. The same kind of hidden bearish divergence for Ethereum in the Composite Index also exists for XRP. XRP will be in danger of further sell-side pressure if it closes below the Cloud at $0.99. From there, bears may push XRP to test prior support near $0.84. If a breakout above the Cloud occurs, then the path to $3.00 should be relatively smooth.
XRP/USD Daily Ichimoku Chart
Traders and investors on both sides of the market should be prepared to see XRP price consolidate even further into October, until at least October 20th when the Cloud thins out to a mere sliver.
Author

Jonathan Morgan
Independent Analyst
Jonathan has been working as an Independent future, forex, and cryptocurrency trader and analyst for 8 years. He also has been writing for the past 5 years.



