XRP price faces minor sell-off before Ripple bulls target 11% climb
- XRP price has been moving steadily within an ascending parallel channel as it continues to record higher highs.
- A crucial technical indicator suggests that Ripple may have recorded a local top.
- Bulls should not be underestimated as buyers accumulate XRP.

XRP price is headed for a minor sell-off before the bulls gather strength to bolster Ripple toward the upside by 11%, targeting $1.30. A key technical indicator has suggested that the cross-border remittance token has recently reached its local top, prompting a small correction.
XRP price witnesses minor weakness
XRP price has been hit with a top signal on October 10, given by the Momentum Reversal Indicator (MRI) on the 4-hour chart. This suggests that Ripple has recorded its swing high and could be headed for a slight reversal.
The cross-border remittance token has fallen to a swing low of 6% following the emergence of the technical signal. XRP price was able to secure a foothold at the 20 four-hour Simple Moving Average (SMA) but is now struggling to overcome the middle boundary of the ascending parallel channel.
Although the prevailing chart pattern suggests that XRP price is headed higher, the token could fall further if it fails to slice above $1.17, the middle trend line of the parallel channel. Further weakness in the market could see Ripple descend toward the 50% Fibonacci retracement level at $1.13, which is also near the 20 four-hour SMA.
A spike in selling pressure would incentivize Ripple to move toward the lower boundary of the governing technical pattern at $1.09, near the 50 four-hour SMA. This area should act as considerable support for XRP price. However, if the bears continue to take charge at this point, the token would discover an additional line of defense at the 38.2% Fibonacci retracement level at $1.06, coinciding with the support line given by the MRI.
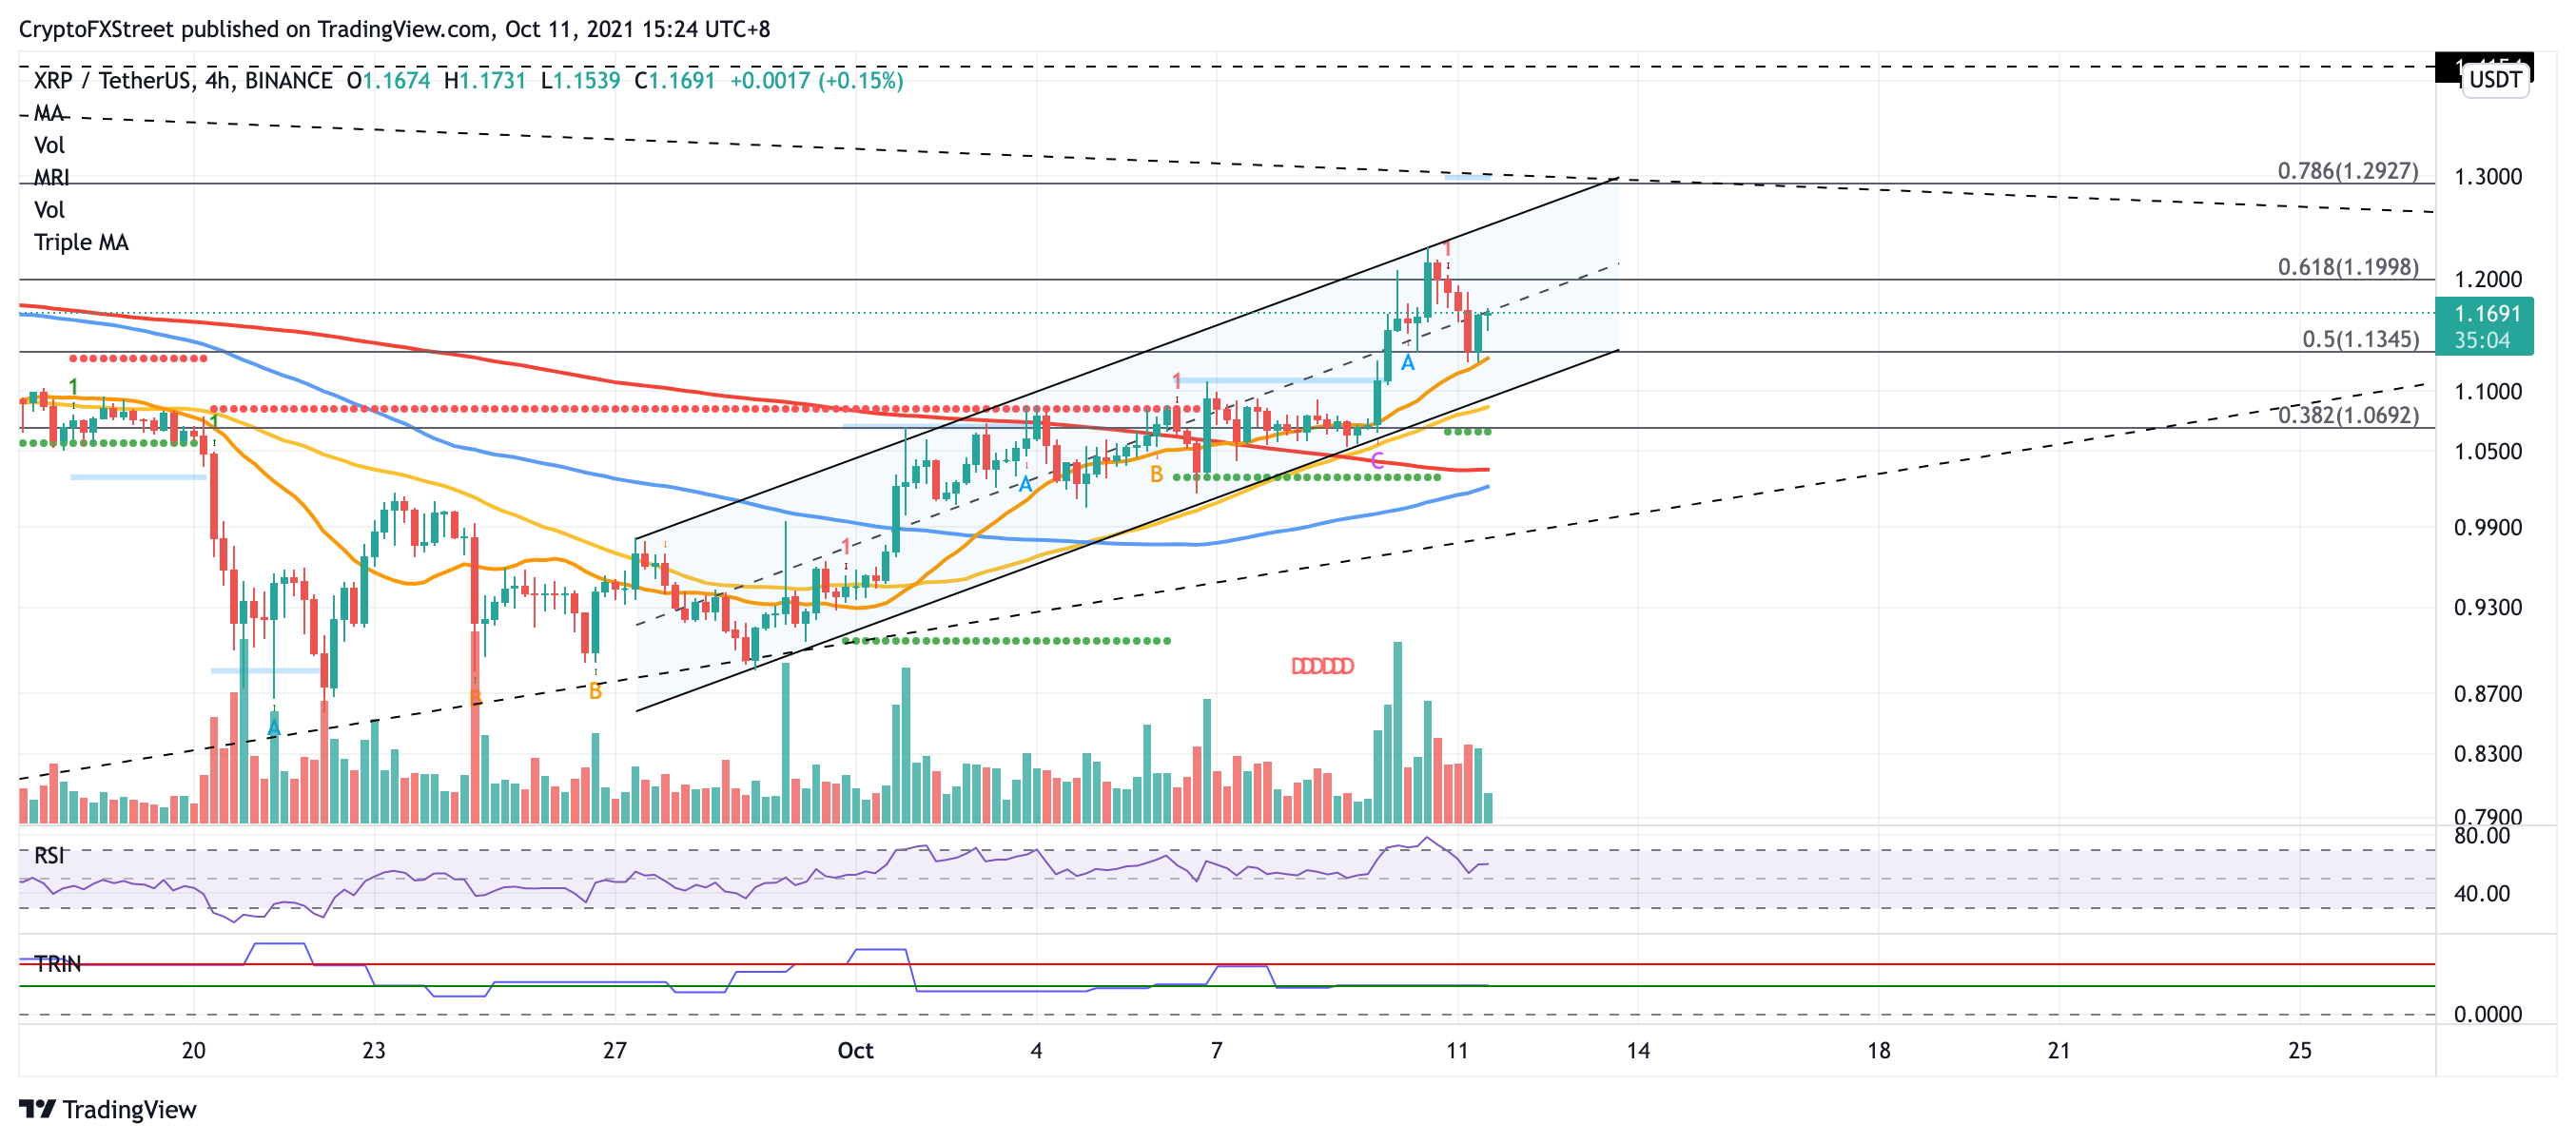
XRP/USDT 4-hour chart
If the momentum shifts to the upside, Ripple would first need to overcome the resistance at the middle boundary of the parallel channel at $1.17. The following obstacle for XRP price is at the 61.8% Fibonacci retracement level at $1.19, then at the October 10 high at $1.23.
Bigger aspirations will target the upper boundary of the chart pattern at $1.29, coinciding with the 78.6% Fibonacci retracement level, as well as the declining resistance trend line that formed from April of this year. Cutting through this thicket could be difficult, but it is crucial for the long-term outlook of the XRP bulls. Breaking above $1.29 could see Ripple challenge the September 7 high at $1.41, then the May 16 high at $1.70.
Author

Sarah Tran
Independent Analyst
Sarah has closely followed the growth of blockchain technology and its adoption since 2016.



