Top 3 Price Prediction Bitcoin, Ethereum, Ripple: Whale Watching 102 - Don't become the bait
- Bitcoin price shows the largest inflow of volume on to exchanges since 2017.
- Ethereum price could react negatively to the influx of ETH deposited to exchanges.
- Retail traders are positioned heavily short on the XRP price.

The crypto market has witnessed an influx of volatility, likely enticing traders to open long positions in hopes of a Q3-Q4 rally. However, beneath the hood, bearish signals may be overlooked. Statistically, October and November are usually bullish months for crypto. There is nothing wrong with casting a rod in treacherous water, but risk management should be applied. Don't become the bait when fishing for gains.
Bitcoin price looks scary underneath the hood
Bitcoin price is fighting for grounds as the bulls have accomplished a 5% recovery rally after an overnight liquidation. Despite the optimistic retaliation, there are on-chain metrics that are looking bearish underneath the hood.
IntoTheBlock's Inflow Volume Indicator shows 287,000 Bitcoin have been onboarded to all exchanges on September 14. With an average price of $20,000 BTC, more than 2% of the entire crypto market has suddenly become liquid. The increased liquidity justifies the erratic price swings that have occurred this month. Market makers need prices to move to keep retail traders interested. It is worth noting that the 287,000 BTC tokens are the largest influx of supply on two exchanges in the last five years.
Based on these metrics, an assumption can be made that high-cap players are interested in securing profits. Thus, the Bitcoin price could be due for a sweep-the-lows event in the coming weeks targeting $17,000. Such a move would result in a 12% decline from the current Bitcoin price.
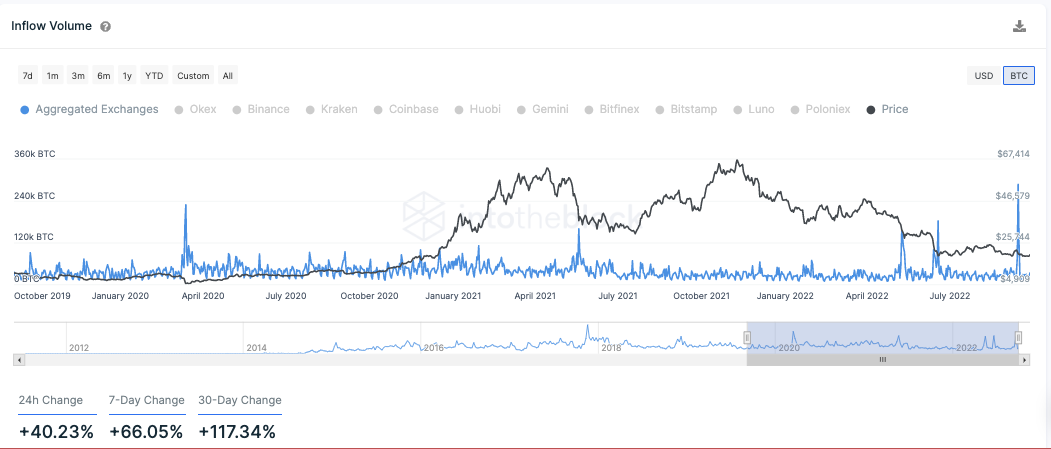
IntoTheBlock’s Inflow Volume Indicator
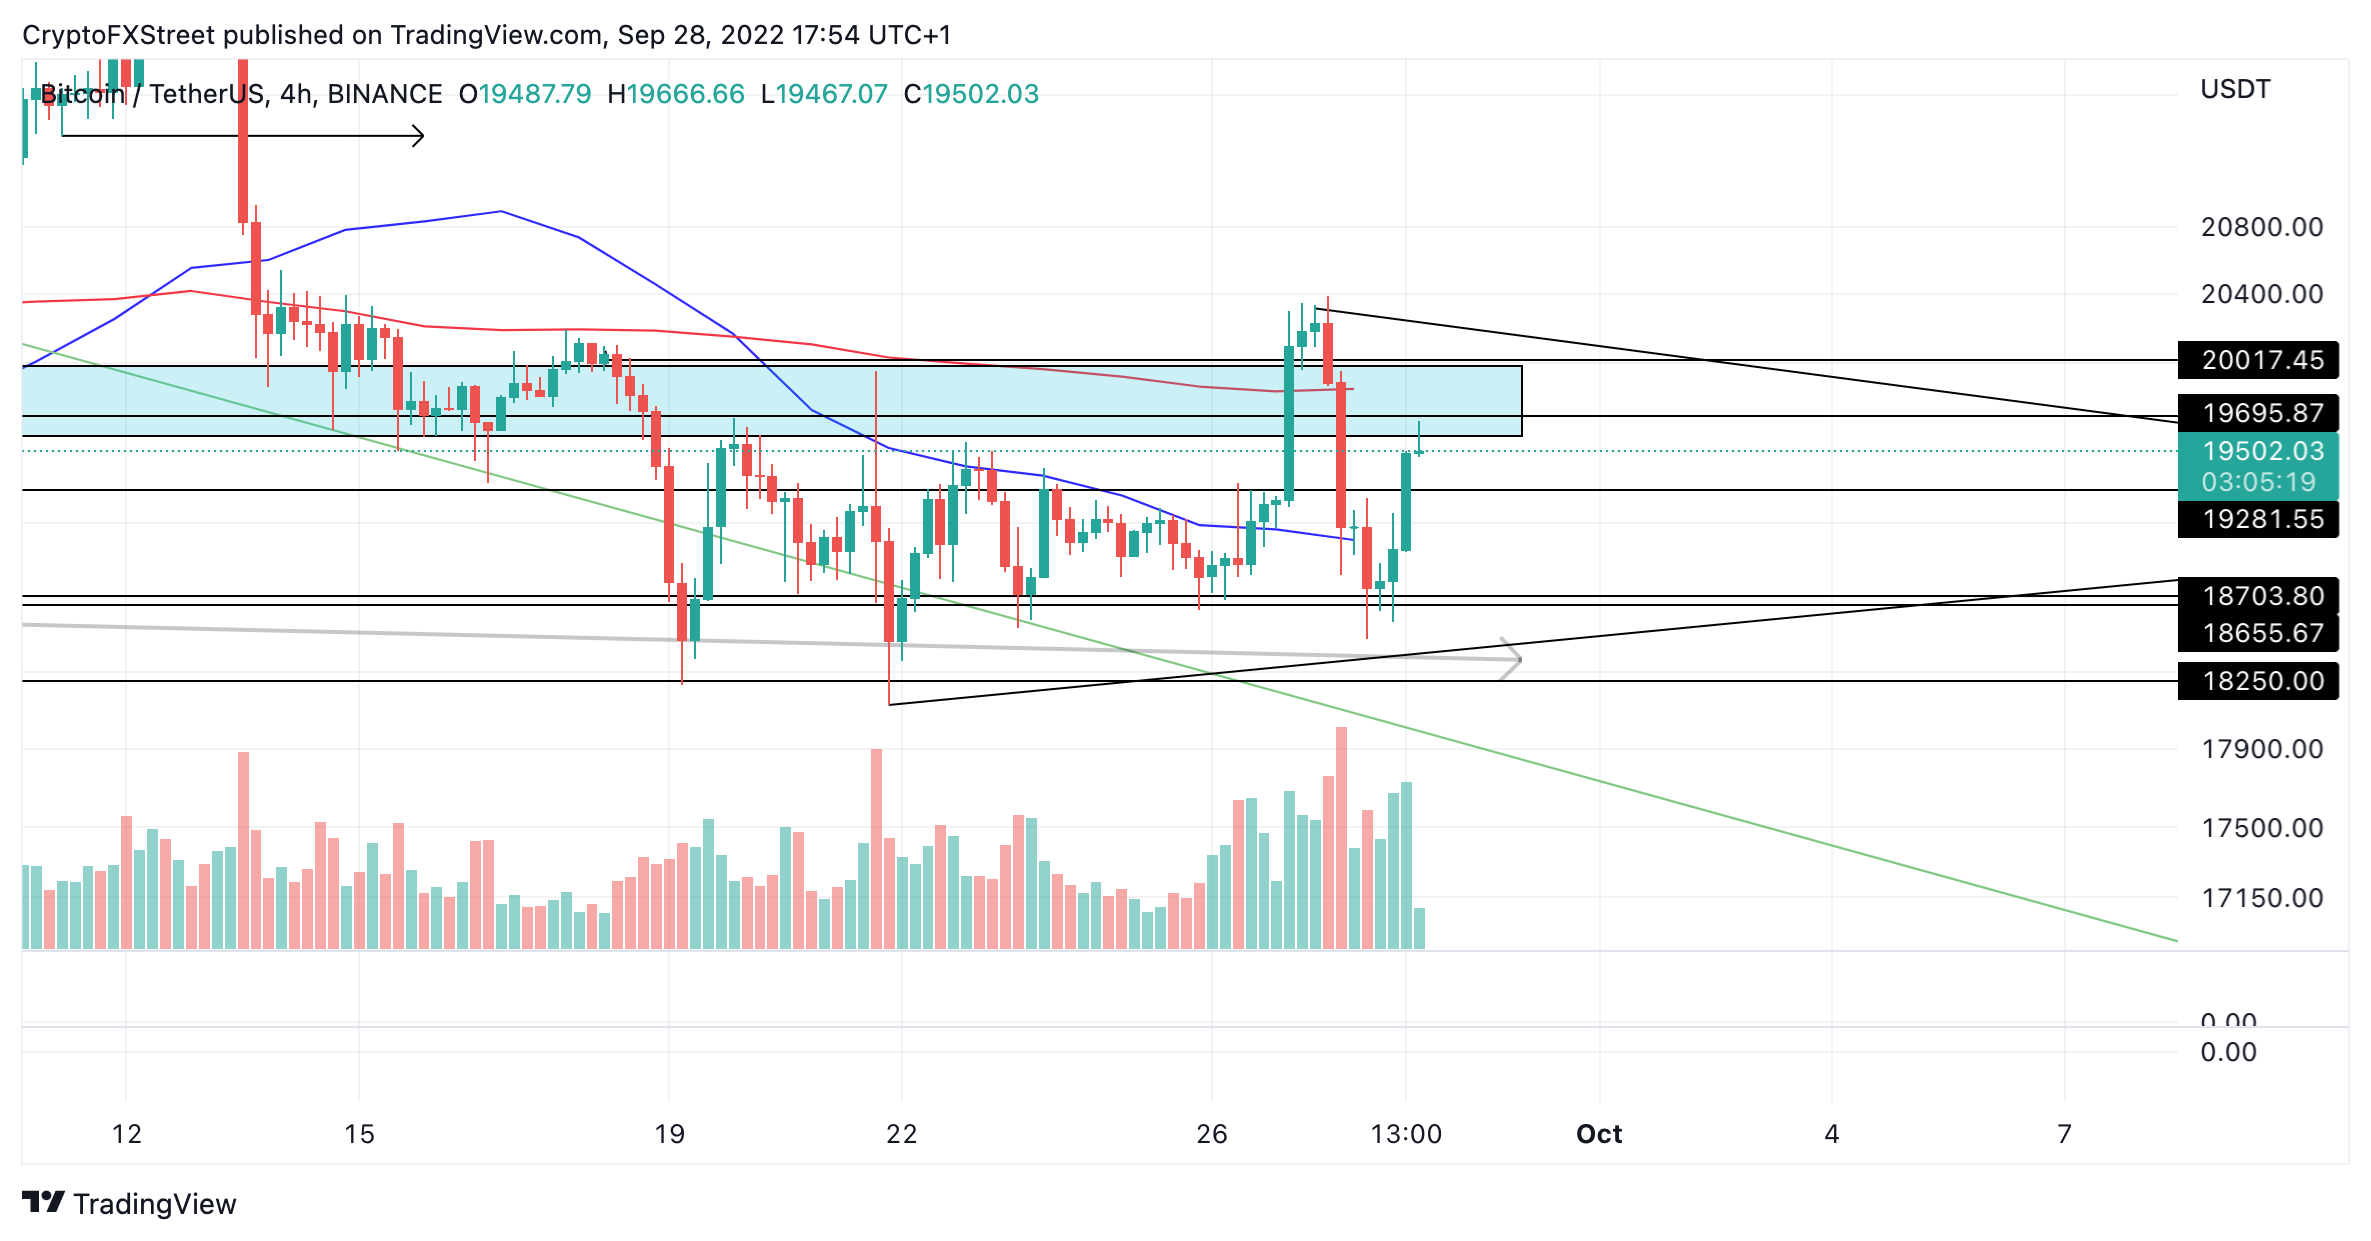
BTC USDT 4-Hour Chart
In the following video, our analysts deep dive into the price action of Bitcoin, analyzing key levels of interest in the market. -FXStreet Team
Ethereum price could sweep the summer lows
Ethereum price currently auctions at $1,333, showing subtle signals that merit concern. According to Santiment's Supply On Exchange Indicator, there has been a persistent uptick in supply distributed onto exchanges since August. In theory, the metrics suggest that more supply on exchanges means more handlers ready to sell the Ethereum price.
Consequently, the decentralized smart contract token may be a short-term opportunity rather than a long-term investment play among institutional traders. That said, Investors should keep an open mind when analyzing the technicals.
The recent breach of the $1,250 level disqualified the impulsive count. There is a potential for the ETH price to sweep the summer lows at $880. Such a move would result in a 33% decline from the current market value. Although it is still relatively early to call, a loss of the $1,006 low could be the catalyst to induce the much larger decline.
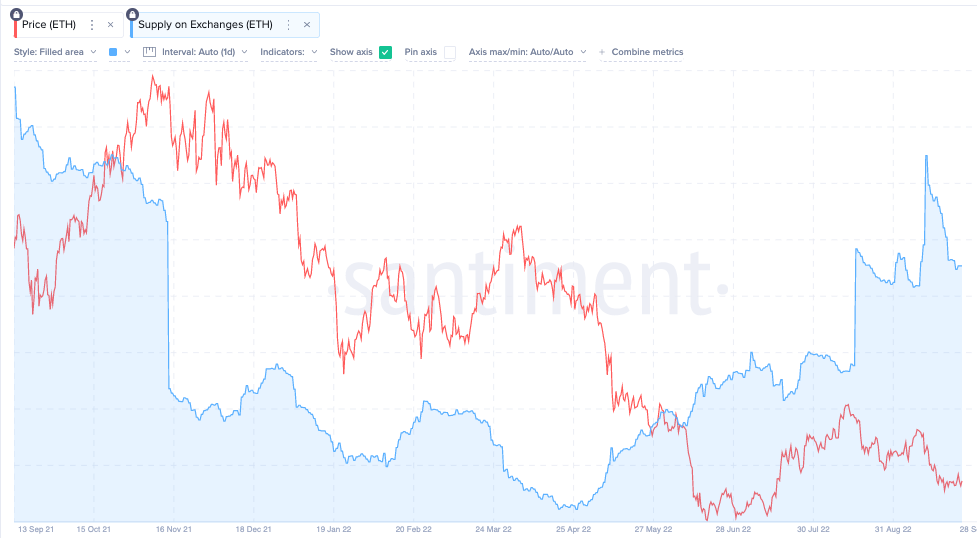
Santiment’s Supply On Exchanges Indicator

ETH USDT 4-Hour Chart
In the following video, our analysts deep dive into the price action of Ethereum, analyzing key levels of interest in the market. -FXStreet Team
XRP price could rally once again
XRP price currently auctions at $0.4343. The bears forged a 7% decline during the overnight session after breaching the 8-day exponential moving average. During the New York open, the bulls stepped back in, prompting a 5% recovery rally. Still, on-chain metrics show the current counter-trend pullback may be a disguise for a much larger move.
According To CoinGlass' Long vs. Short Indicator, most traders with open XRP positions are going short. At a 60-40 split, the last time retail was positioned so heavily to the downside was September 20, when XRP traded at $0.37. By September 23, XRP rallied 47% into the monthly high at $0.56.
Based on the contrarian bullish metrics, XRP could rally into previous congestion zone near $0.60 in the coming days. In doing so, a significant amount of leveraged bears would be liquidated from their trades. Such a move would result in a 30% increase from the current XRP price. Safest of the bullish play is a breach of the summertime swing lows at $0.31. Traders with a higher risk tolerance could use the recent $0.35 barrier as the line in the sand that should not be lost.
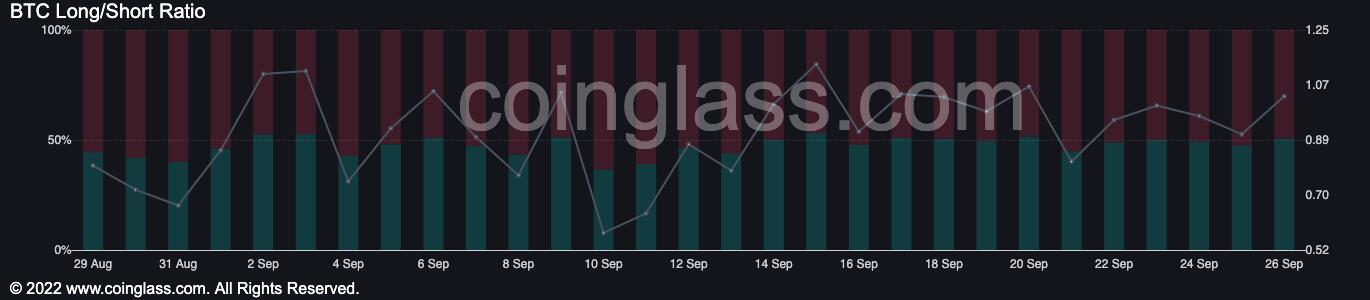
CoinGlass Long vs.Short Indicator
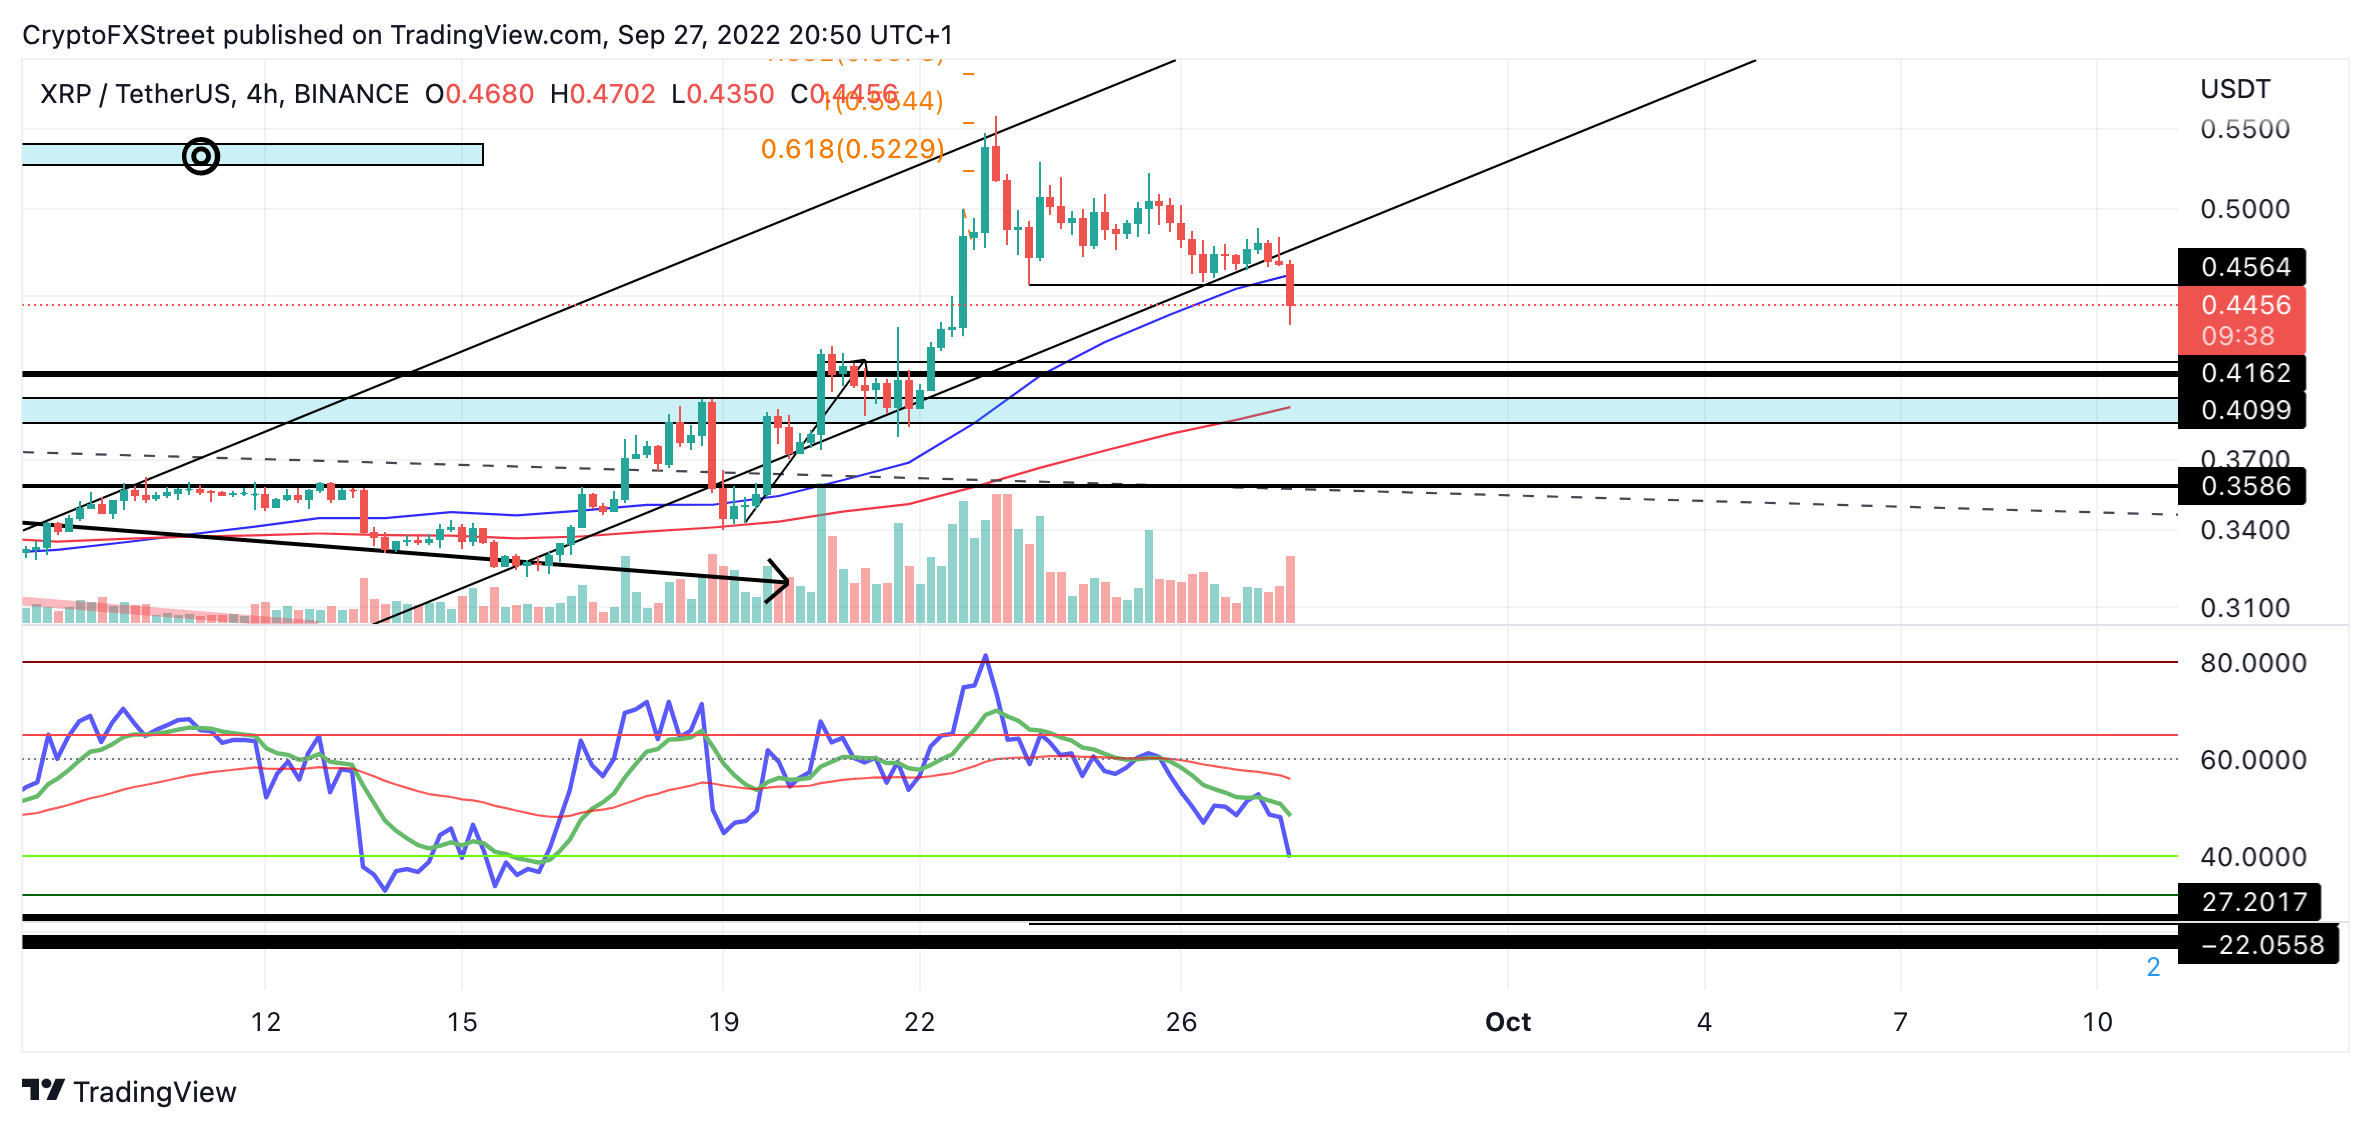
XRP USDT 4-Hour Chart
In the following video, our analysts deep dive into the price action of Ripple, analyzing key levels of interest in the market. -FXStreet Team
Author

Tony M.
FXStreet Contributor
Tony Montpeirous began investing in cryptocurrencies in 2017. His trading style incorporates Elliot Wave, Auction Market Theory, Fibonacci and price action as the cornerstone of his technical analysis.


