Top 3 Price Prediction Bitcoin, Ethereum, Ripple: What Wall Street doesn't want you to know pt.2
- Bitcoin price shows smart money accumulation signals. A bottom may be near.
- Ethereum price is likely to witness an influx of volatility, a swing trader's approach may be the most suitable.
- Ripple price remains in a bearish stronghold based on recent bearish influence.

Part two of an Elliott Wave, technical, and on-chain anlalytical thesis used to gauge current market behavior and forecast the next directional moves in the crypto market.
Bitcoin price looks bullish under the hood
Bitcoin price currently trades at $19,982. The recent breach of the $20,000 barrier has many analysts calling for a sweep-the-lows event of the June 18 bottom at $17,622. Based on the technicals, the call is justified. The Volume Profile shows an uptick near the top of the August bullrun, signaling smart money involvement. Additionally, the bears have persistently rejected Bitcoin's re-entrance of the $20,000 barrier on intra-hour time frames.
Still, a few on-chain analytical tools convey a different message. For example, the Santiments' 365-day Bitcoin Circulation map shows a massive decline in yearly circulating tokens. There are currently 5.96 million tokens in circulation, which is the lowest reading in the last six years. The last time this amount of tokens were in active circulation was in 2016, when Bitcoin traded at $5,711.
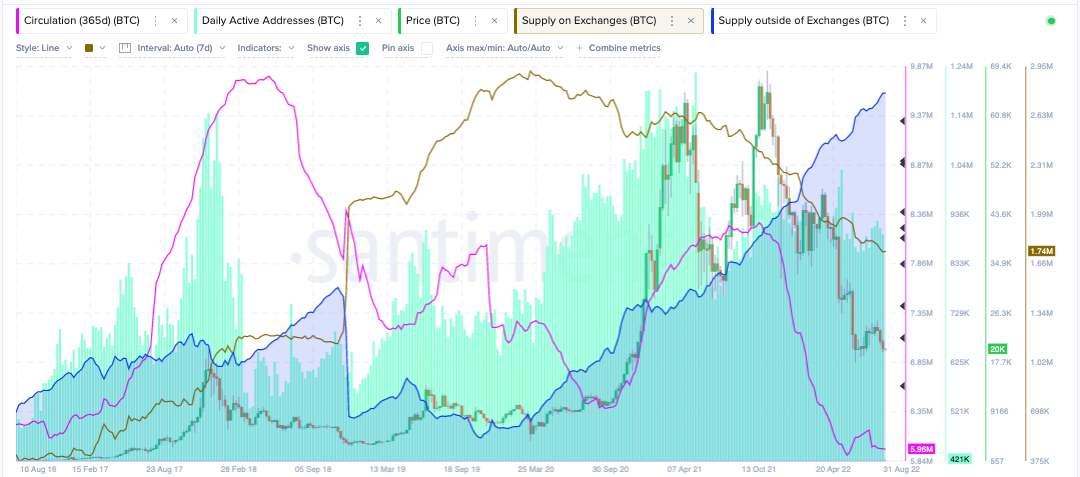
Santiment’s Price, 365-Day Circulation-Supply On & Off Exchanges Indicators
The Total Bitcoin Supply On All Crypto Exchanges indicator continues to fall. At 1.74 million currently, the exchanges are holding the lowest amount of liquid Bitcoins since October 2018, just before Bitcoin fell from $6,000 to the $3,000 lows.
Lastly, the Supply Outside of Exchanges indicator is going parabolic. At a new all-time high of 2.75 million Bitcoins, this indicator suggests whoever is buying Bitcoin is uninterested in short-term gains. In theory, the lower supply of tokens on the exchanges creates more demand for the token amongst retail and institutional investors.
In the following video, our analysts deep dive into the price action of Bitcoin, analyzing key levels of interest in the market. -FXStreet Team
Ethereum price tells a different story
Ethereum price has outperformed Bitcoin this summer by nearly 150%. Compared to Bitcoin’s 42% rally, the decentralized smart contract saw an increase of 126% since the June 18 liquidation.
ETH price currently auctions at $1,571. The technicals show a downtick in volume amidst the current sell-off, which is an optimistic signal of more gains to come.
Still, on-chain analysis tools suggest ETH will have difficulty repeating its impressive performance. Unlike Bitcoin, Santiment's Total Supply on Exchanges Indicator is actually turning to the upside.
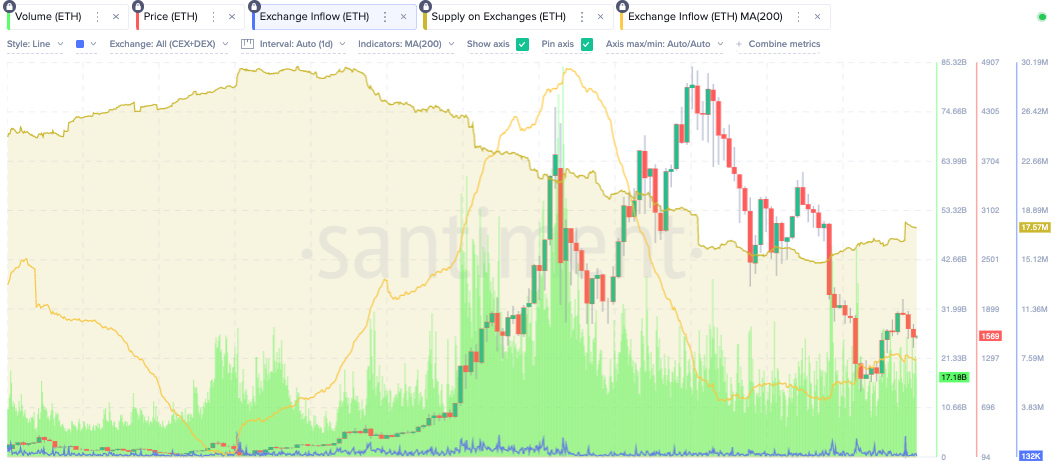
Santiment’s Price, Volume, 365-Day Circulation-Supply On Exchanges Indicators
Currently, at 17.6 million tokens, the last time the Ethereum inventory was this high on all exchanges was in November 2021, when the ETH price auctioned between the $4,200-$4,600 range.
In theory, the indicator suggests Ethereum price could be a volatile token ideal for day traders in the coming weeks. However, new all-time highs will be harder to accomplish than for its Bitcoin counterpart.
In the following video, our analysts deep dive into the price action of Ethereum, analyzing key levels of interest in the market. -FXStreet Team
Ripple price remains in bearish limbo
XRP price currently auctions at $0.325 as the digital remittance continues to underperform relative to its peers. Since June, the digital remittance token has rallied by 35%. What had once appeared to be a profit-taking consolidation near $0.37 ended up morphing into an all-out sellers frenzy, with the Ripple price declining 10% in one day on August 19.
The bearish August 19 engulfing candle is now the largest candle for the summer, hinting that the bears are now in control. The Volume Profile Indicator is progressively increasing in transactions amidst each market decline. Lastly, the XRP price has witnessed a rejection from both the 8- & 21-day simple moving averages, which will likely entice sidelined bears to jump in for more downside potential.
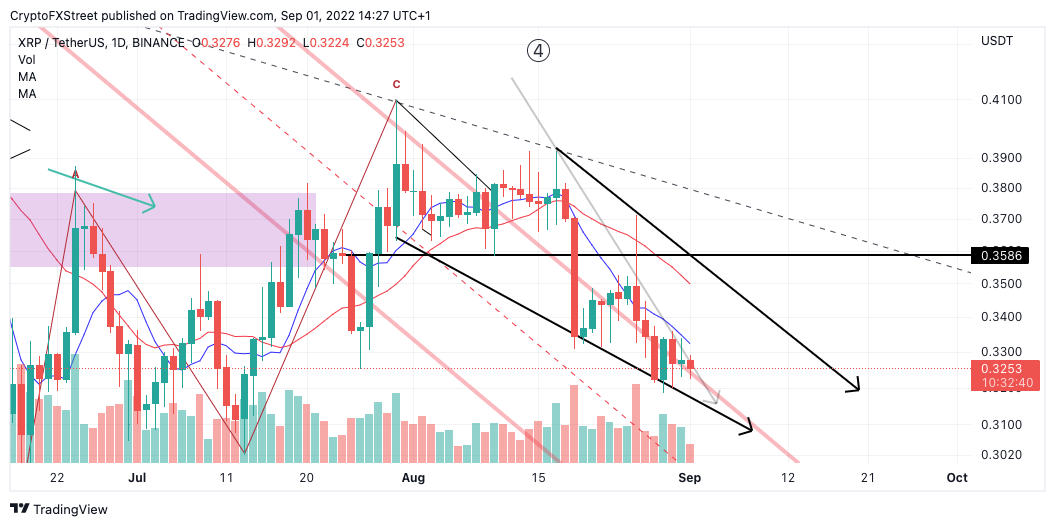
XRP/USDT 1-day chart
When combined, the XRP price could dispel a whirlwind of pain in the coming weeks. The bears are likely aiming for targets between $0.28 and $0.24. Traders looking to join the trend should keep an invalidation point above $0.41.
Traders should be wary of placing an entry too soon as closing a candle above $0.33 on the daily level could catalyze a sharp rise towards $0.37 in the short term.
In the following video, our analysts deep dive into the price action of Ripple, analyzing key levels of interest in the market. -FXStreet Team
Author

Tony M.
FXStreet Contributor
Tony Montpeirous began investing in cryptocurrencies in 2017. His trading style incorporates Elliot Wave, Auction Market Theory, Fibonacci and price action as the cornerstone of his technical analysis.


