Top 3 Price Prediction Bitcoin, Ethereum, Ripple: Why you shouldn't get overly bearish near these levels
- Bitcoin price falls after trapping overnight and early morning bulls.
- Ethereum price has space to rally higher despite the recent sharp decline.
- Ripple could present a profitable knife catch opportunity in the coming days.

The crypto market pulls a fast one as an overnight rally has been completely reversed. Still, there is potential that a market bottom is near.
Bitcoin price dives south
Bitcoin price has fallen penny-from-Eiffel style during the New York session on Tuesday, September 27. During the overnight session, the BTC price witnessed an 8% rally. The uptrend's move likely enticed retail traders to go long and may now as a smart money trap that breaks Bitcoin's back.
Bitcoin price currently auctions at $19,122. An influx of volume can be spotted on smaller time frames amidst the sharp declining move. The bulls are attempting to provide support at the 8-day exponential moving average. If the bulls fail at this price level, the next stop will likely be the September 23 swing low at $18,500.
At the current time, this thesis remains neutral. A directional call cannot be confidently made until more evidence is displayed. Early signs of an uptrend scenario could occur if the bulls can hurdle the recently breached 21-day simple moving average at $19,170. In doing so, Bitcoin price could make a run for the September highs at $22,799. Such a move would result in an 18% increase from the current Bitcoin price.
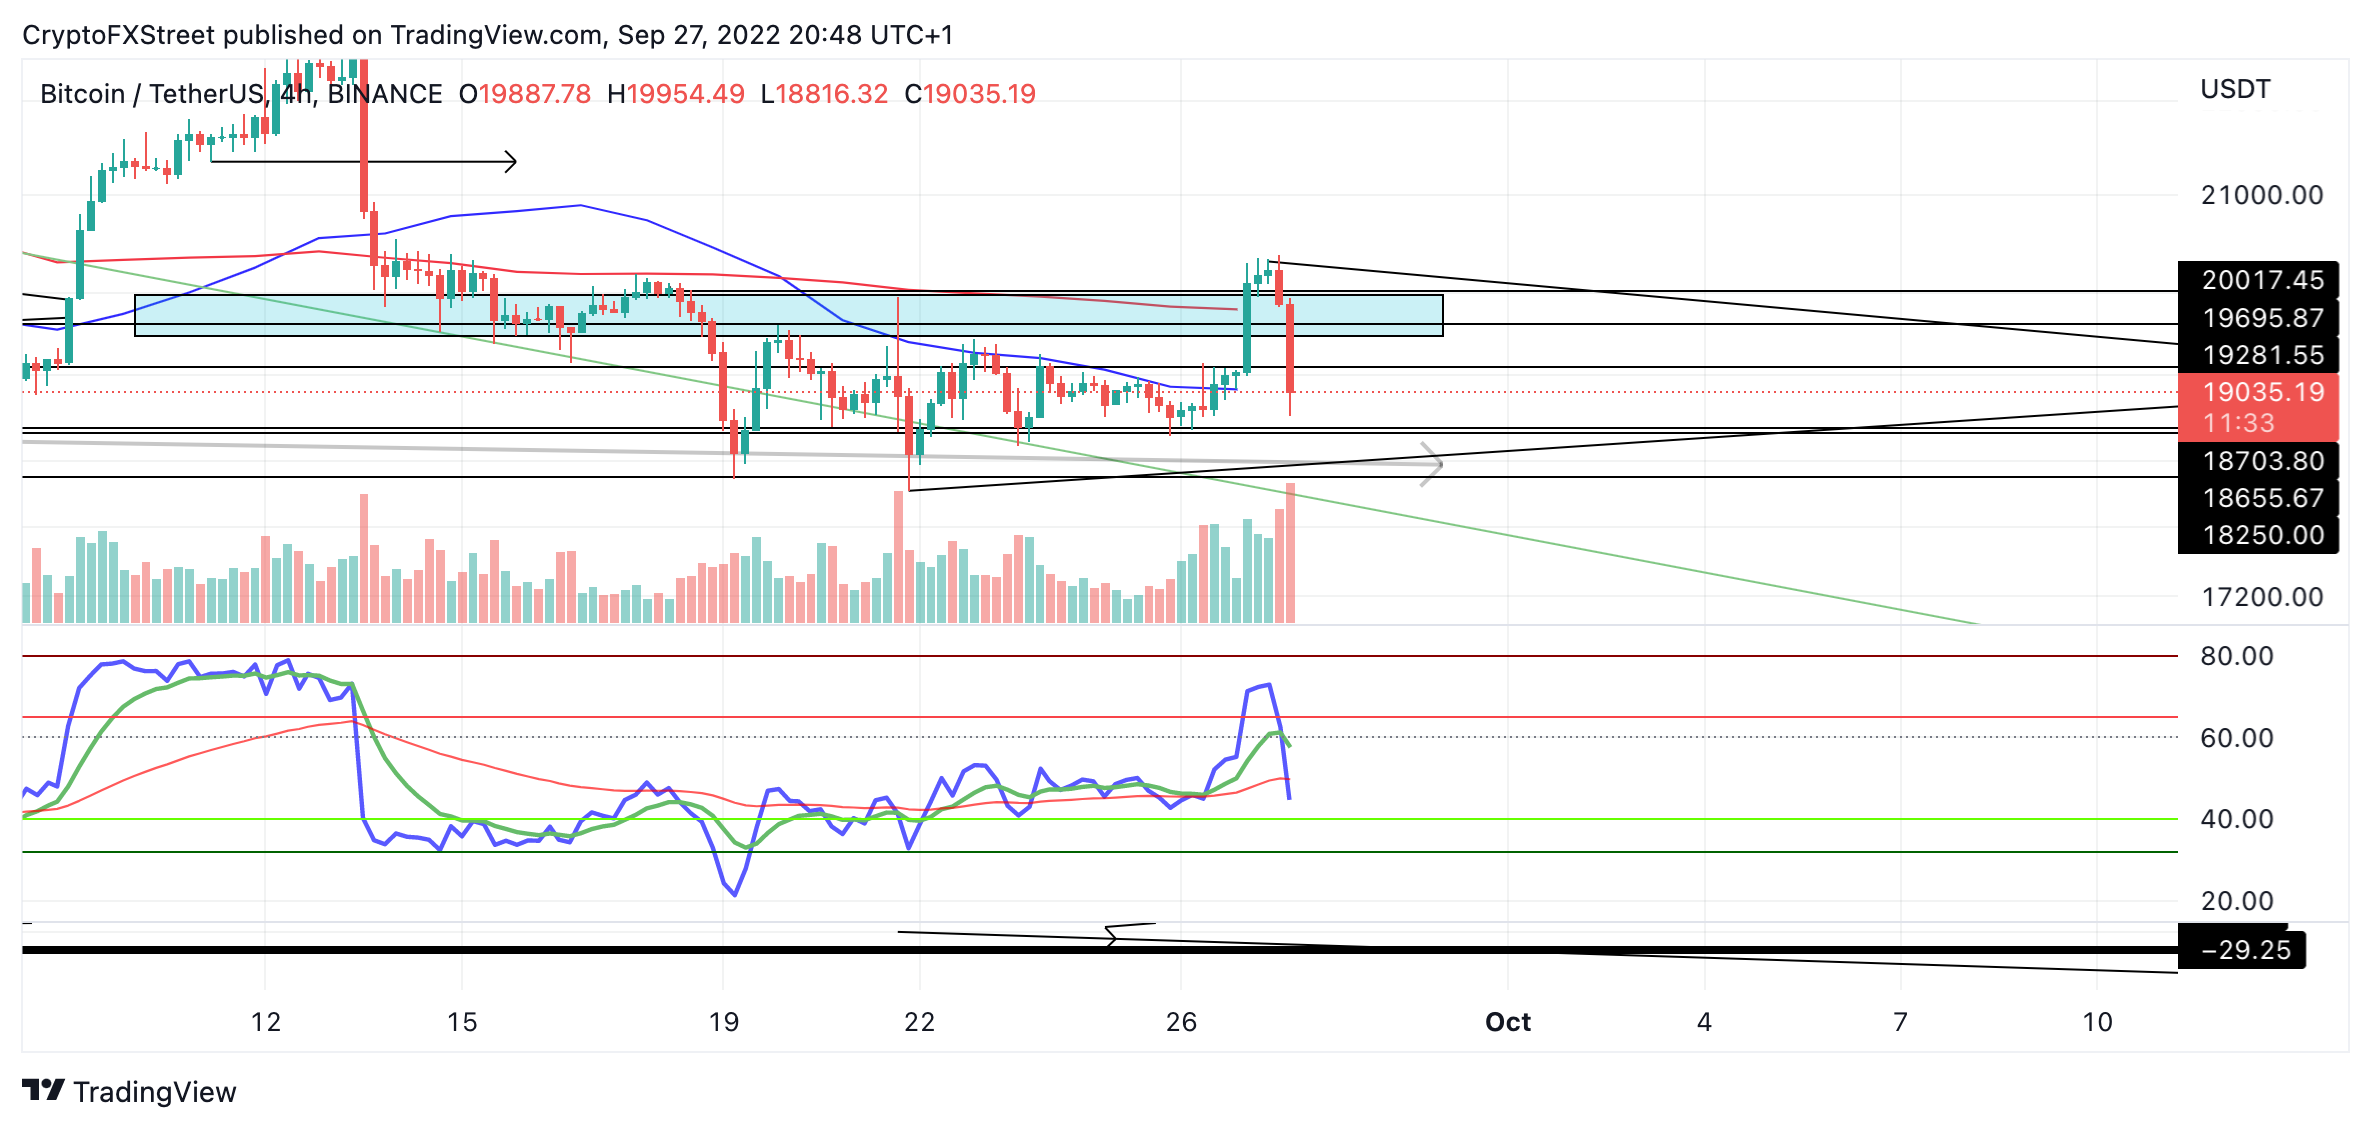
BTC USDT 4-Hour Chart
In the following video, our analysts deep dive into the price action of Bitcoin, analyzing key levels of interest in the market. -FXStreet Team
Ethereum price takes a plunge
Ethereum price is currently down 7% in 24 hours as the bears have flexed a sharp liquidation after the overnight rally. Like Bitcoin, Ethereum price is testing the 8-day exponential moving average. Although the decline looks nearly identical to the BTC's, there is less volume amidst the Ethereum decline, suggesting that more erratic price action could be underway.
Ethereum price currently auctions at $1,324. Despite the sharp decline, the smart contract token is still within bounds of healthy uptrend territory on the Relative Strength Index. If the bulls sustain their presence above the 8-day exponential moving average, then an uptrend move should not be ruled off the table.
Unlike Bitcoin, the 21-day simple moving average at $1,492 has not yet been tagged. A rally could ensue at this level, resulting in a 12% increase from the current Ethereum price.
Invalidation of the uptrend would occur if the September lows at $1,220 were breached. If the bears accomplish said price action, the ETH price could re-route south towards liquidity, levels at $1,100, resulting in a 14% decrease from the current Ethereum price.
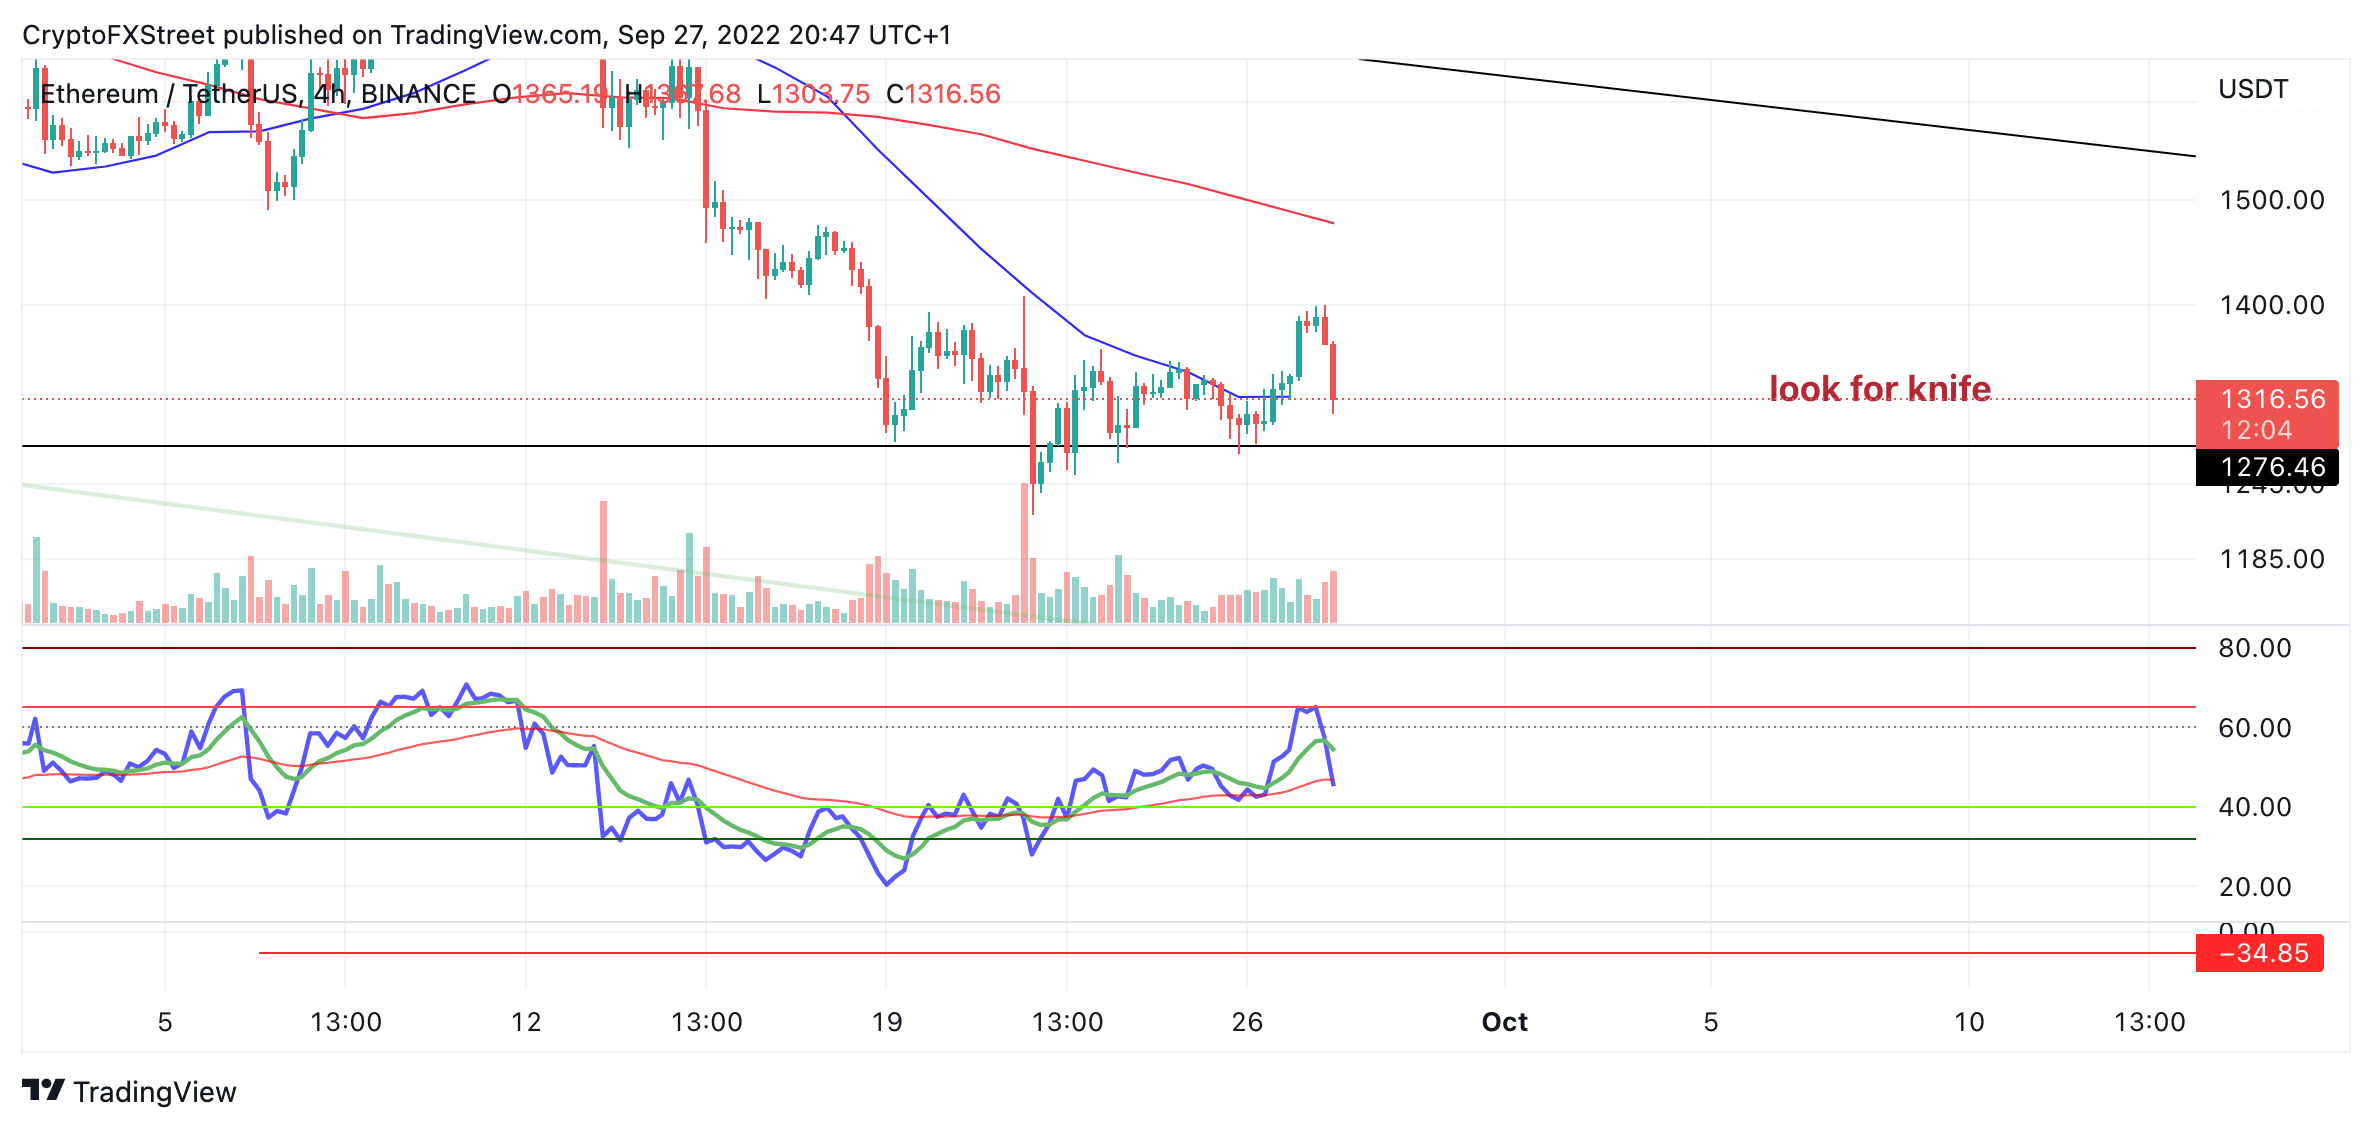
ETH USDT 4-Hour Chart
In the following video, our analysts deep dive into the price action of Ethereum, analyzing key levels of interest in the market. -FXStreet Team
XRP price could be the knife to catch
XRP price has invalidated the triangle-looking consolidation amidst the recent downswing. Within the last 24 hours, Ripple has lost 8% of its market value. However, unlike Bitcoin and Ethereum, the XRP price has breached and settled below the 8-day exponential moving average
. An uptick in volume is displayed with a large bearish engulfing candle. Traders may be looking for a plummet into the 21-day simple moving average at $0.39. However, the RSI shows Ripple auctioning a definitive line in the sand for a bull market correction. Getting overly bearish near these levels could be problematic.
XRP currently auctions at $0.4532. A Fibonacci retracement tool surrounding the steepest decline within the recent 70% bull rally last week shows the current correction as just over a 38.2% retracement level. That said, a new high near $0.61 should not be ruled off the table in the short term. Traders looking to catch a knife should keep the invalidation at the September 16 swing low at $0.32 until market conditions suggest otherwise.
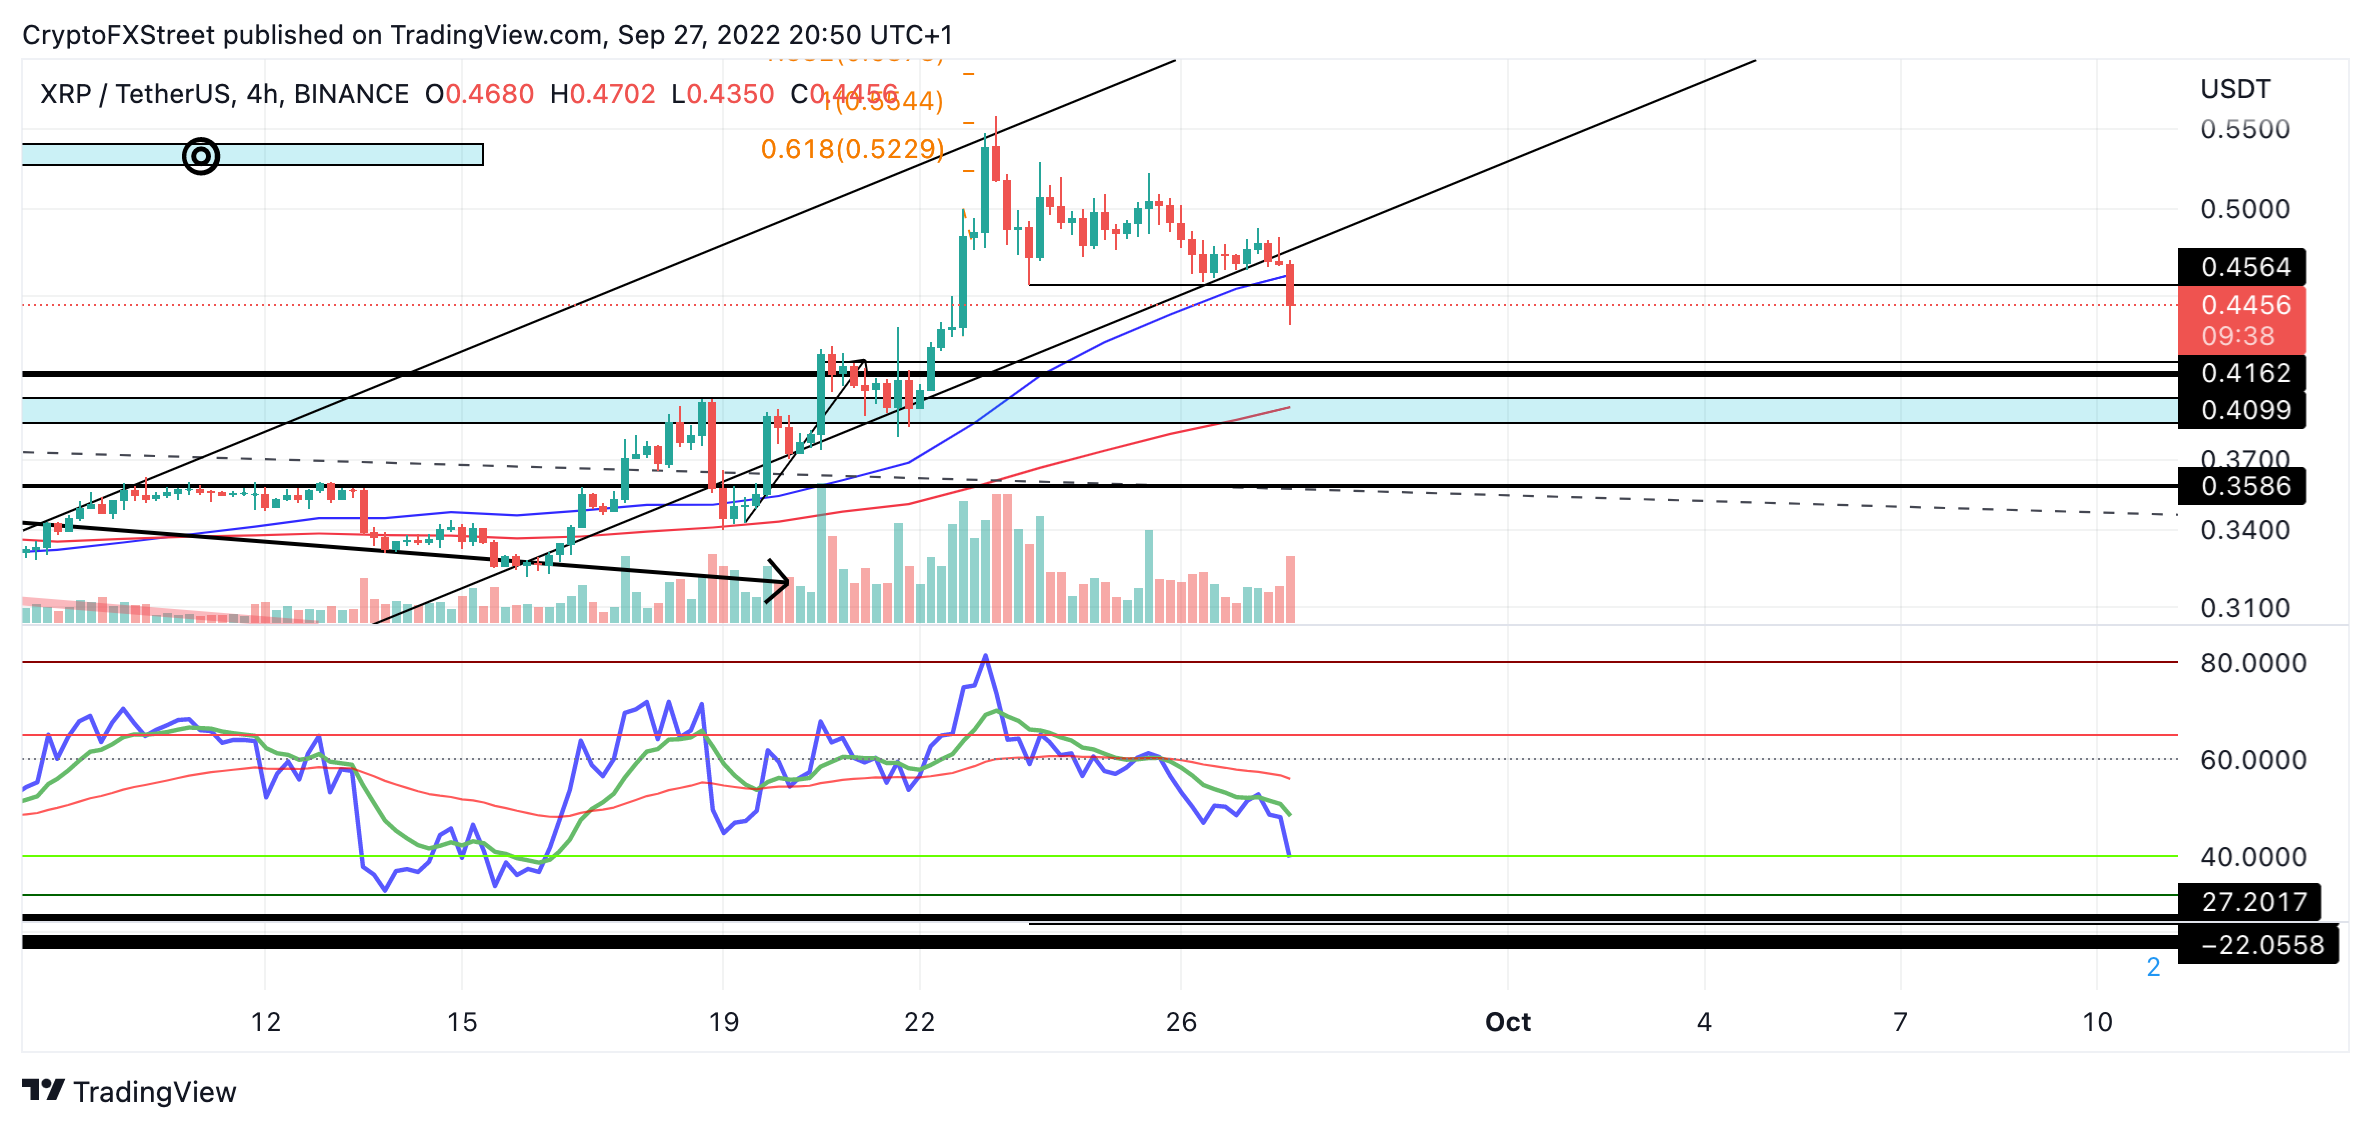
XRP/ USDDT 4-Hour Chart
In the following video, our analysts deep dive into the price action of Ripple, analyzing key levels of interest in the market. -FXStreet Team
Author

Tony M.
FXStreet Contributor
Tony Montpeirous began investing in cryptocurrencies in 2017. His trading style incorporates Elliot Wave, Auction Market Theory, Fibonacci and price action as the cornerstone of his technical analysis.


