Top 3 Price Prediction Bitcoin, Ethereum, Ripple: The monthly settle defines the next move
- Bitcoin price is submerged below a trading range, which could lead to another selloff.
- Ethereum price is coiling within a range that could project ETH into the $400 price zone.
- XRP price will need to close above $0.46 to invalidate a possible dip into the sub $0.30 price levels.

The crypto market is at a standstill going into the final days of November. The monthly price will likely depict price action for weeks to come, and the market could witness an uptick in volatility. Traders should keep their eye on the key levels identified for any last-minute moves.
Bitcoin price consolidates beneath previous support
Bitcoin price currently auctions at $16,419 as the bulls and bears are sparring over the mid $16,000 level on smaller time frames. During the last weekend of November, the BTC price witnessed a 3% decline and printed a higher low at $15,995. Although the bulls were able to rebound, BTC has since stalled underneath the former support zone that formed near $16,700 during the first two weeks of the month.
As November closes, it is best to zoom out from smaller time frames and look at the bigger picture. Bitcoin price is currently down 20% from where it began on November 1. If the consolidation continues, BTC will print a large bearish engulfing pattern on the monthly time frame. Classical price action techniques allow candlesticks to aim for future targets. Given the context, BTC the bears could justifiably aim for $13,000, a 20% decline from the current market value.
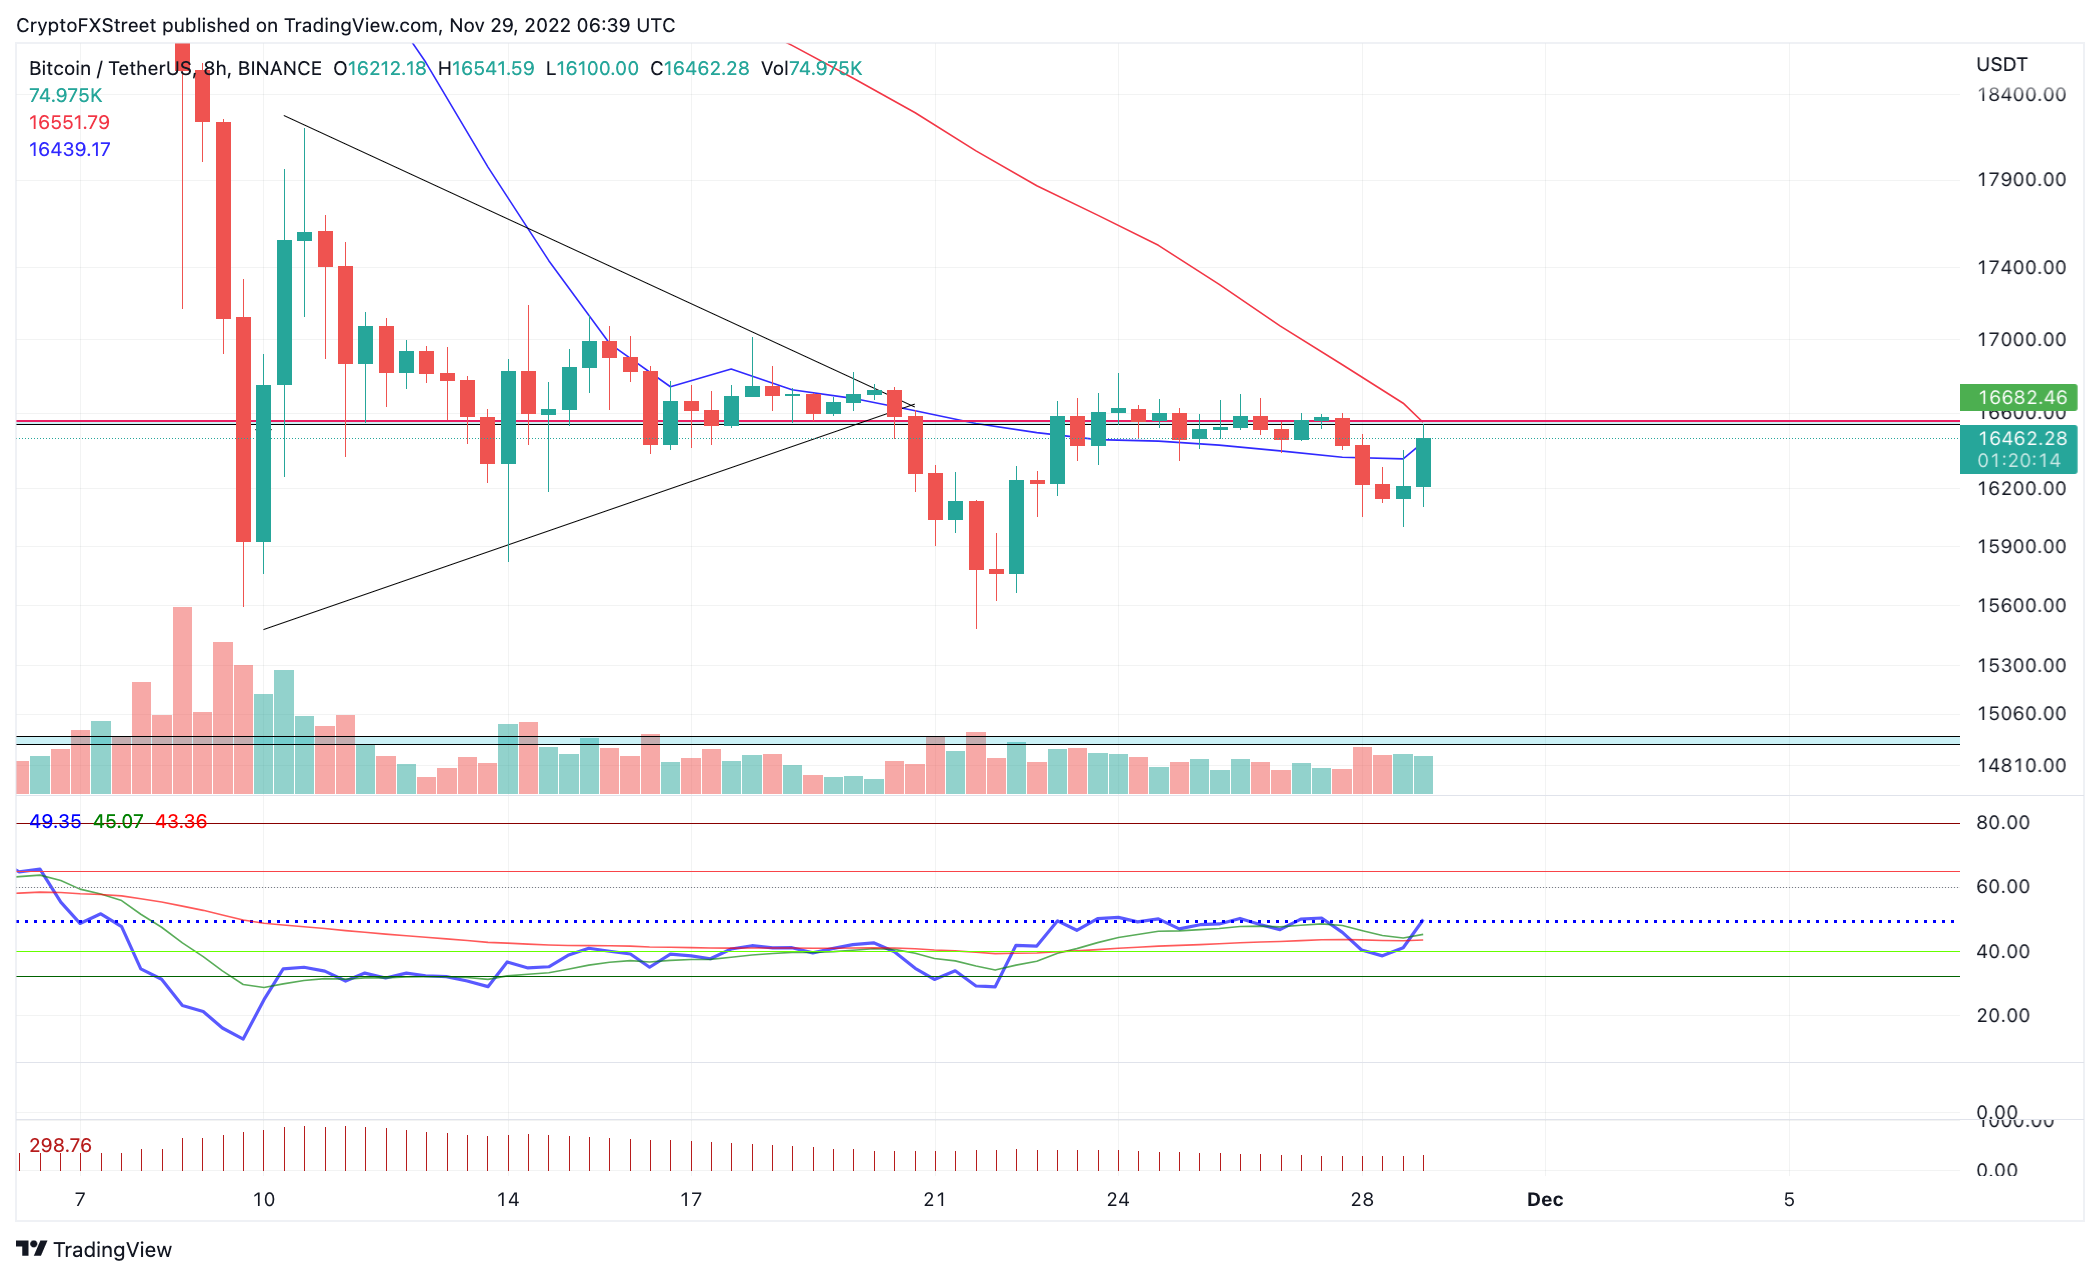
BTC/USDT 1-day chart
Bitcoin will need to pull off a serious move north before the month closes to reduce the bearish potential. A rise back into the $19,000 zone would convert the bearish engulfing candle into a bullish hammer. If this scenario occurs, the bulls could re-route north and target $23,000 in December, resulting in a 20% increase from the $19,000 zone.
Ethereum price is a dangerous long-term investment
Ethereum price is still down 24% on the month despite recovering around 15% since November 22. Although the shorter time frames have provided more opportunities for short-term bulls, the longer time frame’s technicals point to a much more severe bearish scenario.
Ethereum price currently auctions at $1,208. In the last few months, the ETH price appears to have morphed into a range producing higher lows and lower highs. The consolidating price action on the monthly chart may be a triangle, if correct, could project a bearish target near $450. The $450 target zone is a strong confluence as an Elliott Wave Trend Channel surrounding Wave 1, and Wave 2 from the 2019-2020 bull run remains untested near the same area.
Bulls should consider practicing extra preventive measures as a second attempt at the triangle’s ascending trend line at $970, which could catalyze the 56% decline. The bulls need to produce a higher high to invalidate the triangle thesis. A tag above $2,031 would expand the range and create a possibility for a true bull run targeting the psychological $3,000 level. The Ethereum price would rise by 145% if said price action occurred.
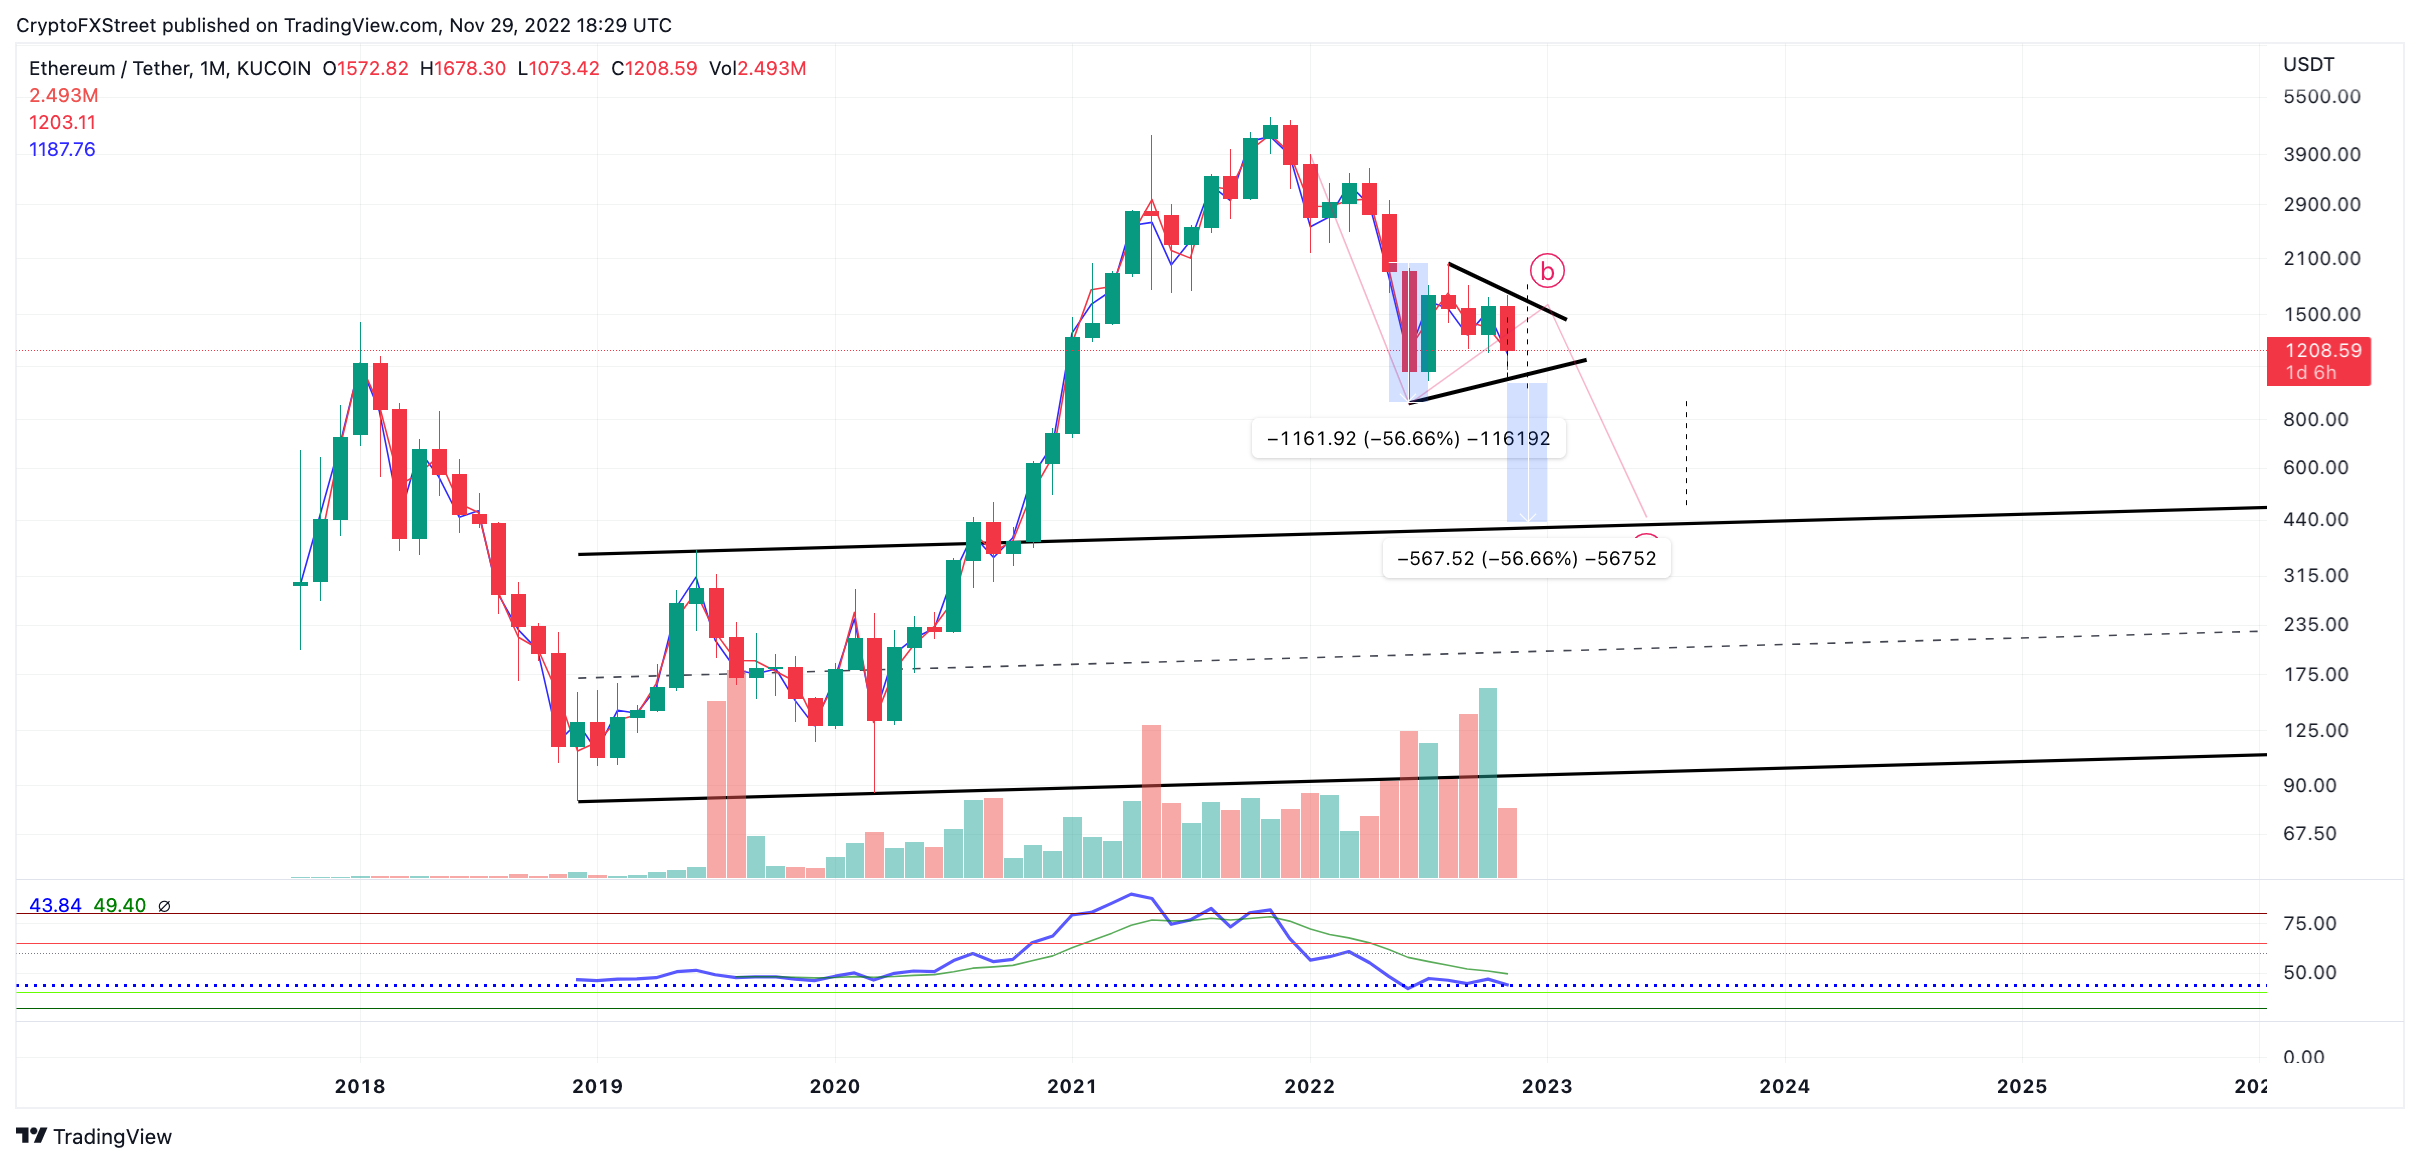
ETH/USDT 1-month chart
XRP price will be a challenge
XRP price is currently the outperforming digital assets amongst the top 3 cryptocurrencies. The bulls have recovered 22% of losses bringing the monthly returns to a 16% decrease in value. However, much like Ethereum, the bears may still be able to induce further sell-offs in the months to come.
XRP price currently trades s at $0.39. The bulls have hurdled the 21-day simple moving average on smaller time frames, which could lead to a shorter liquidity bounce into the October low at $0.42. Nonetheless, the monthly chart is still negative, and even if the 10% pump into the previous support zone occurs, the monthly chart would still produce an Evening Star pattern. Evening stars are reversal patterns very common amongst classical price action traders. Using the size of the last candlestick within the pattern can often project a future target. Given the context, if the Evening Star pattern manifests on the monthly time frame, the XRP price could fall to between $0.25 and $0.22.
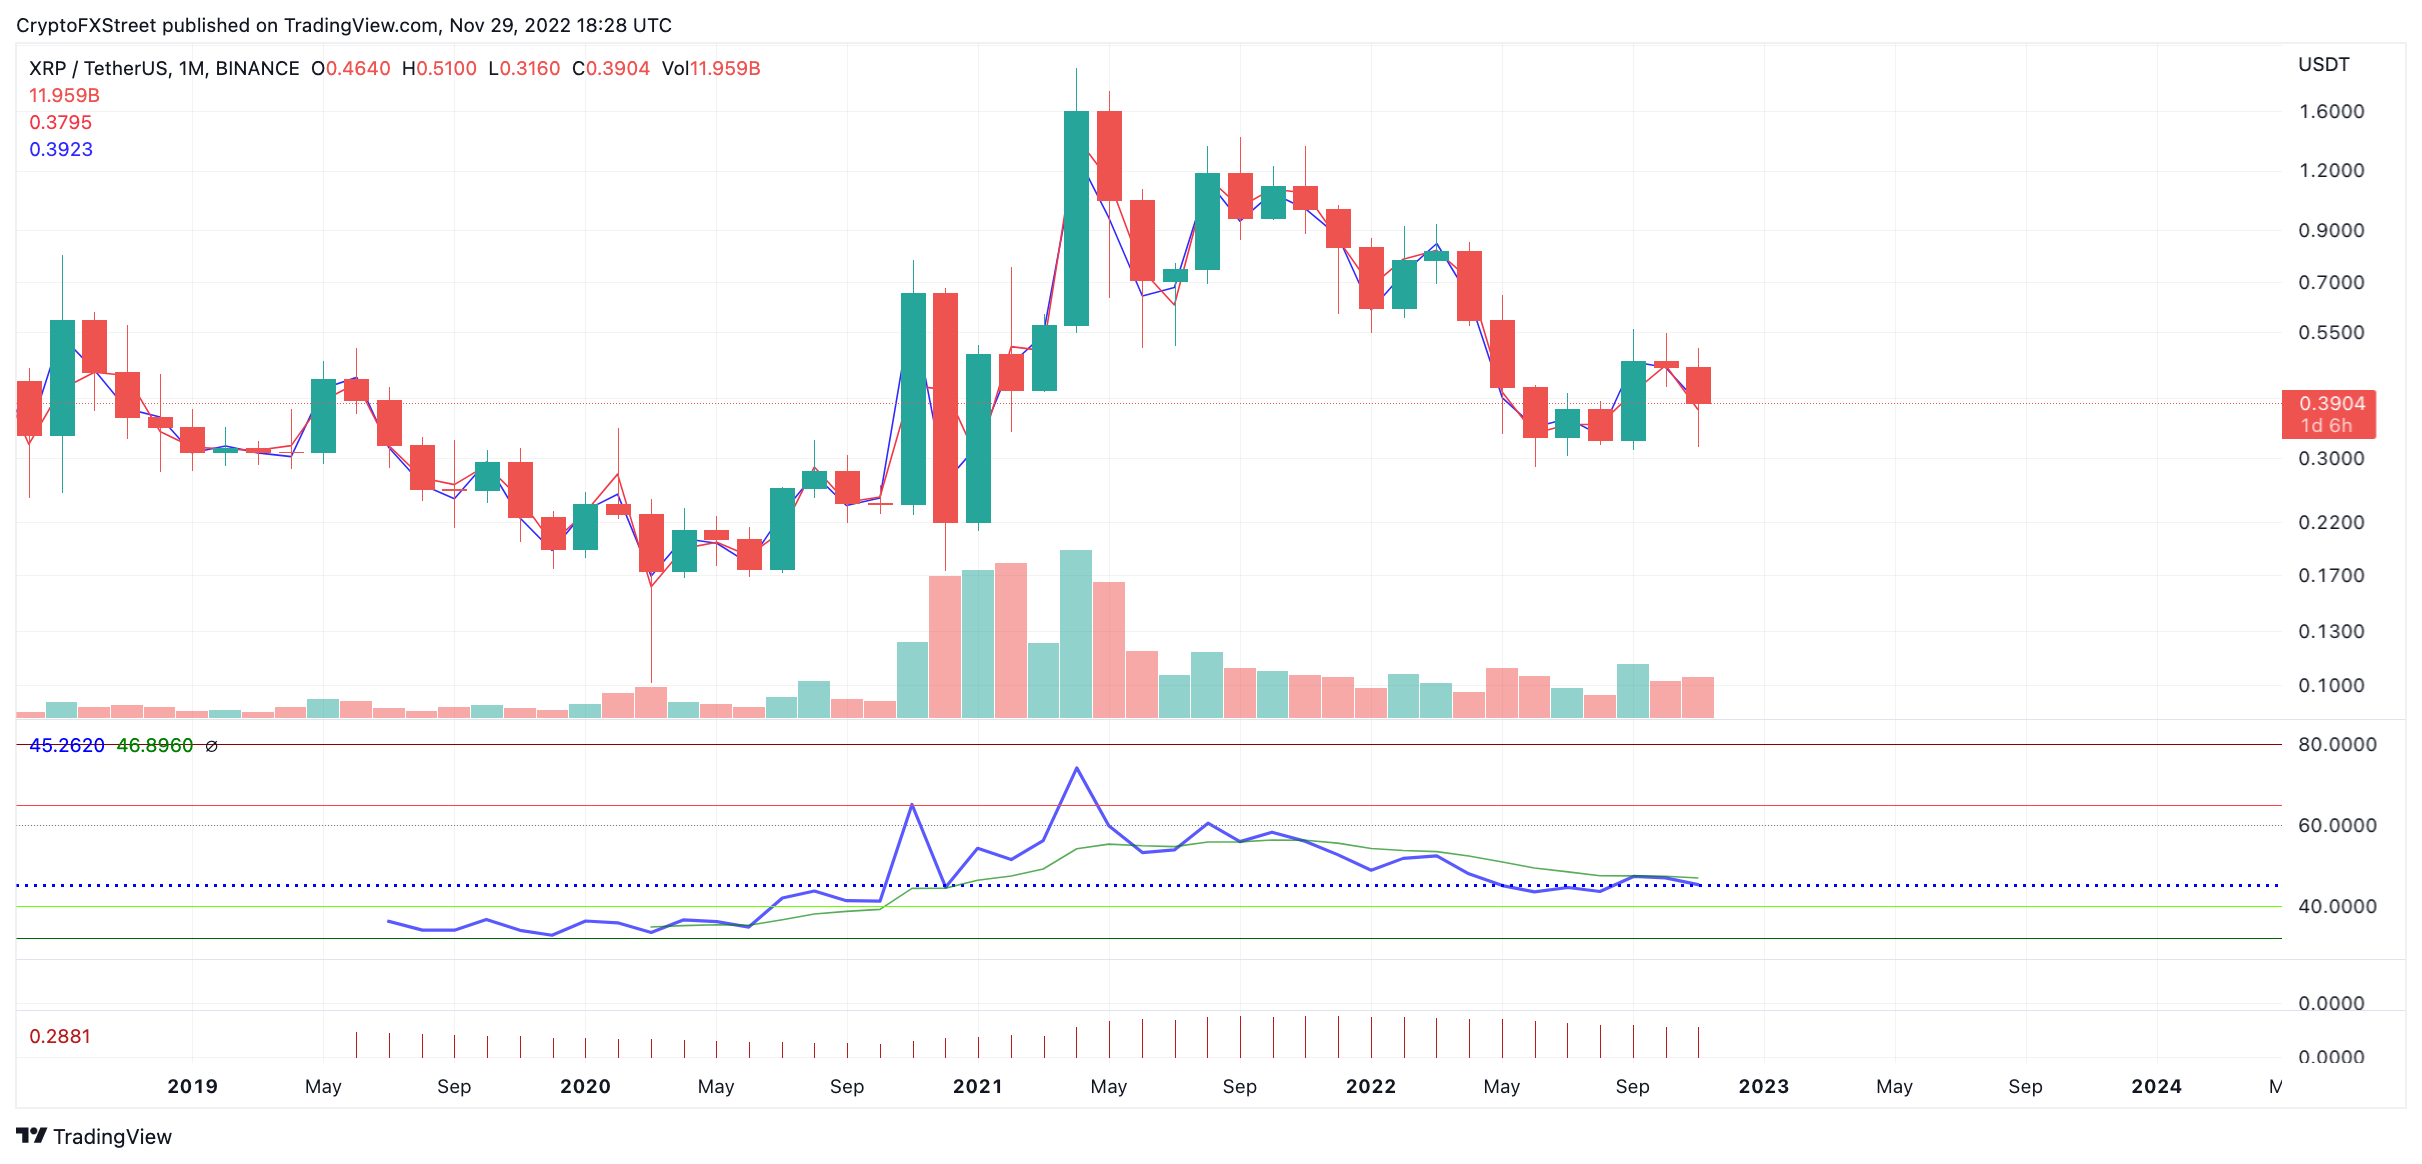
XRP/USDT 1-month chart
XRP will need to close on the monthly chart above November’s opening price at $0.4640 to invalidate the Evening Star pattern and make its bearish potential void. A close above $0.4640 could set up a 40% spike to the upside, targeting the $0.65 untested broken support zone.
Author

Tony M.
FXStreet Contributor
Tony Montpeirous began investing in cryptocurrencies in 2017. His trading style incorporates Elliot Wave, Auction Market Theory, Fibonacci and price action as the cornerstone of his technical analysis.



