Top 3 Price Prediction Bitcoin, Ethereum, Ripple: The crypto moon war, chapter one
- The strong upward movements are a prelude to the long-awaited bull market in cryptocurrencies.
- The strong rises hide a tough fight for market dominance.
- The Bitcoin halving and the launch of Ethereum 2.0 are the rockets that can propel the market towards the Moon.

The pre-established script finally fulfilled, and the crypto market exploded yesterday on the upside a few days before the implementation of the "halving" event in Bitcoin’s mining reward system.
Bitcoin took the lead with a much better behaviour than the rest of the components of the Top 3 cryptocurrencies.
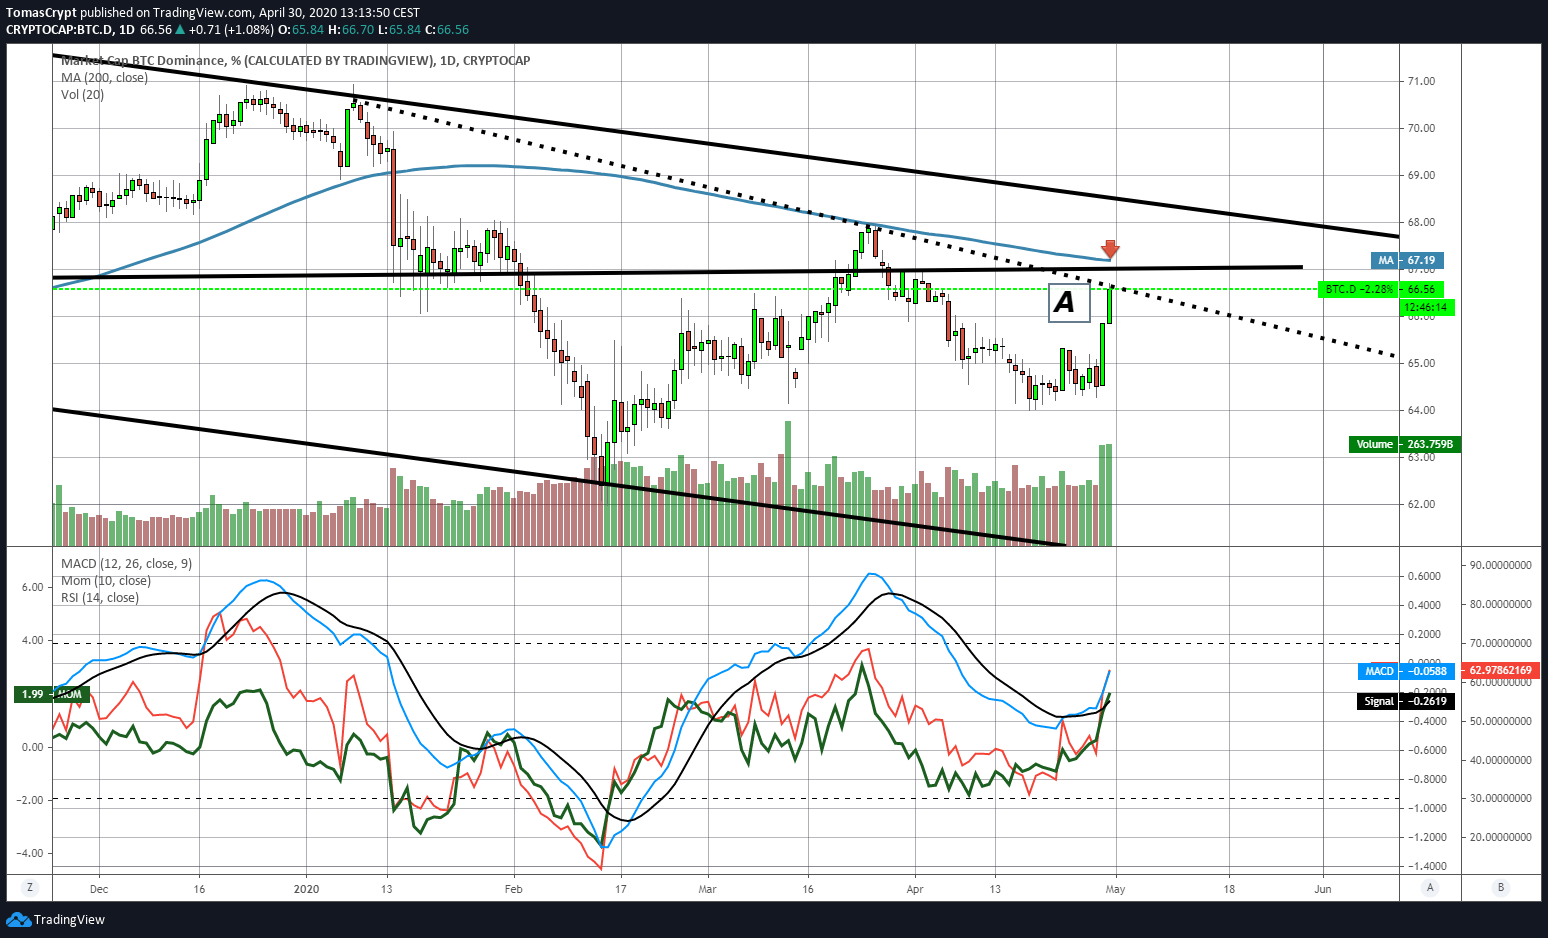
The market is betting on the potential impact on the price of the "halving" event, but we should not lose sight of the next release of the new version of the Ethereum network.
The long-awaited Ethereum 2.0 implements essential improvements, but above all, it can impact the price directly. The central technological development is the migration from a PoW consensus system (based on computational power) to a PoS system (based on Ethers' participation). It is necessary to stake 32 tokens from the Ethereum network to receive distributed rewards, which will lead to a substantial increase in demand for Ethers.
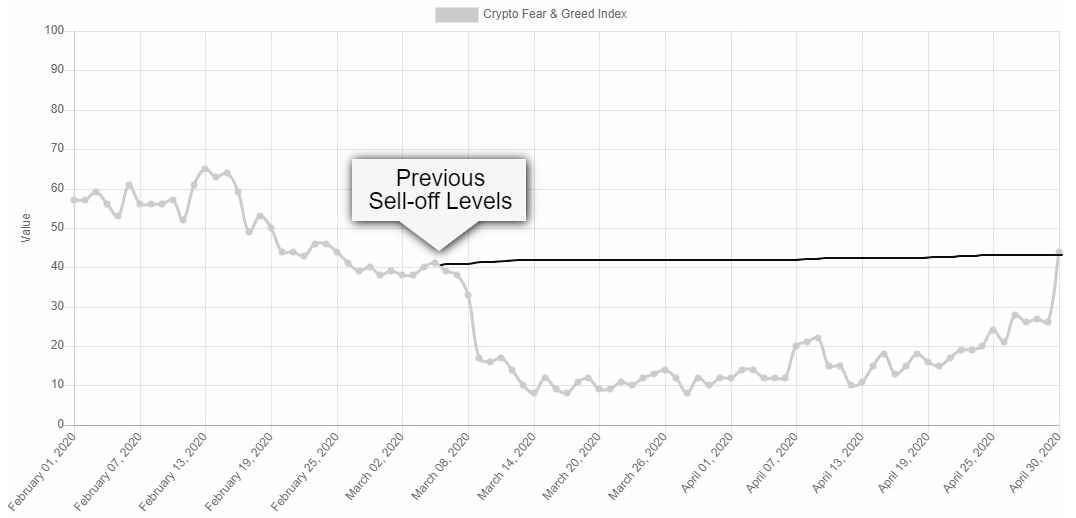
Market sentiment is actively improving and reaches level 44 – mild fear level. Looking at this indicator’s chart for the last three months, we can see how the sentiment level recovers above the level before the March sell-off.
ETH/BTC Daily Chart
The ETH/BTC pair is currently trading at the price level of 0.0241 and shows a sharp upward trend loss that leads to a breakout of the triangular pattern formed in recent sessions.
The fastest-moving averages are at 0.0235, while the 200-day simple moving average is now at 0.0215, a level that should limit the fall.
The market expects the release of version 2.0 of the Ethereum network for next summer, so a scenario of increasing volatility at all Ether crossings is very likely.
Above the current price, the first resistance level is at 0.0255, then the second at 0.0268 and the third one at 0.0275.
Below the current price, the first support level is at 0.0236, then the second at 0.0233 and the third one at 0.0228.
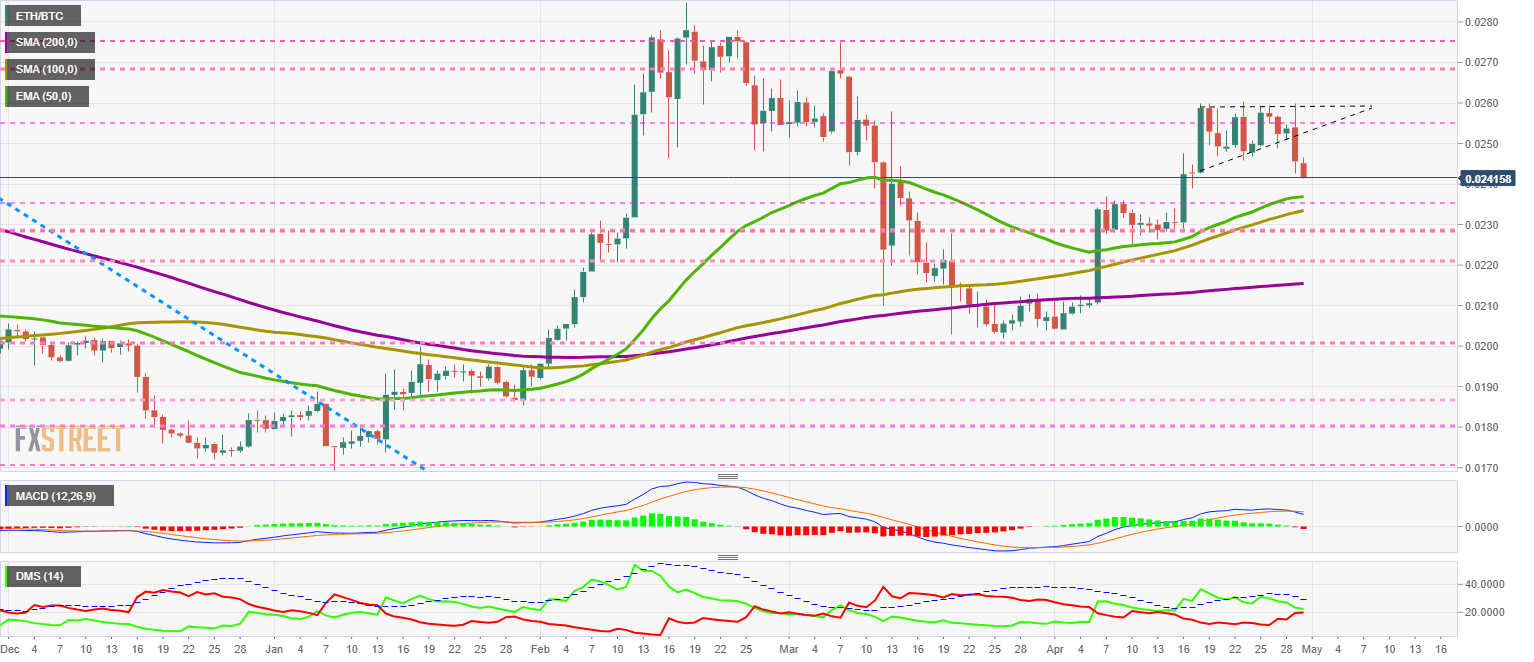
The MACD on the daily chart is crossing downward, confirming the loss of Ether's lead over the rising Bitcoin. The most likely scenario is a continued downward movement to the 0 levels of the indicator, where the Ether's bulls may try again.
The DMI on the daily chart shows how the bulls and bears positions are tied. In this case, it seems that the selling side of the market has all the options to win.
BTC/USD Daily Chart
The BTC/USD pair is currently trading at the price level of $9397 and is encountering resistance to rising prices, a situation related to the current moment in the Bitcoin dominance chart.
The distance to new highs is vast in magnitude but small in the number of hurdles, as breaking through the next six levels of price congestion resistance, headlines will once again be talking about historic highs.
Above the current price, the first resistance level is at $9500, then the second at $10600 and the third one at $11250.
Below the current price, the first support level is at $9250, then the second at $8800 and the third one at $8500.
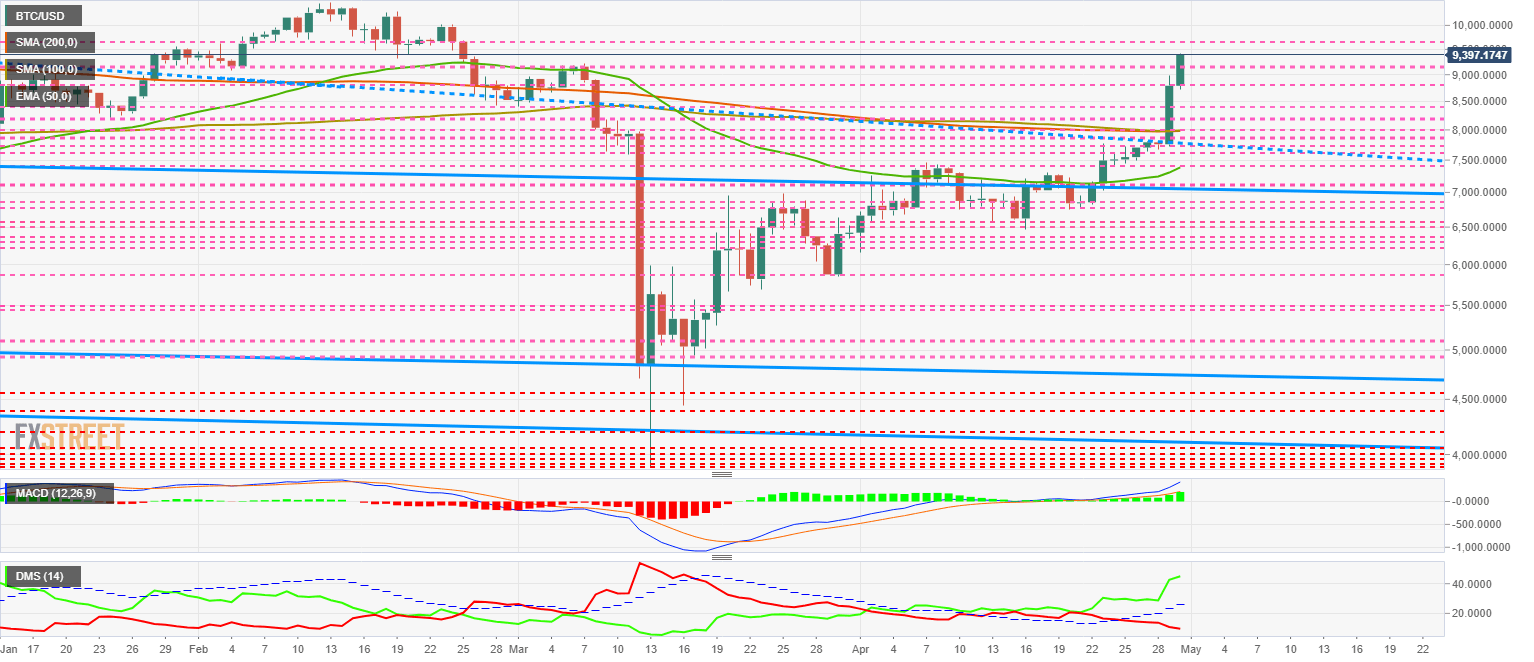
The MACD on the daily chart shows a strong bullish profile and also a vital line separation, which promises further gains, although not without the scares caused precisely by the excess of optimism.
The DMI on the daily chart shows bulls with an absolute advantage over the bears. The upside potential is huge, although as with the MACD, the excesses are always corrected and will bring excitement to the entire rally.
ETH/USD Daily Chart
The ETH/USD pair is currently trading at the $226.9 price level, showing difficulty in overcoming the price congestion resistance level at $230. The current technical resolution of the Bitcoin and Ether dominance charts are the best guides to what lies ahead in the coming days.
Above the current price, the first resistance level is at $230, then the second at $238 and the third one at $250.
Below the current price, the first support level is at $223, then the second at $215 and the third one at $207.
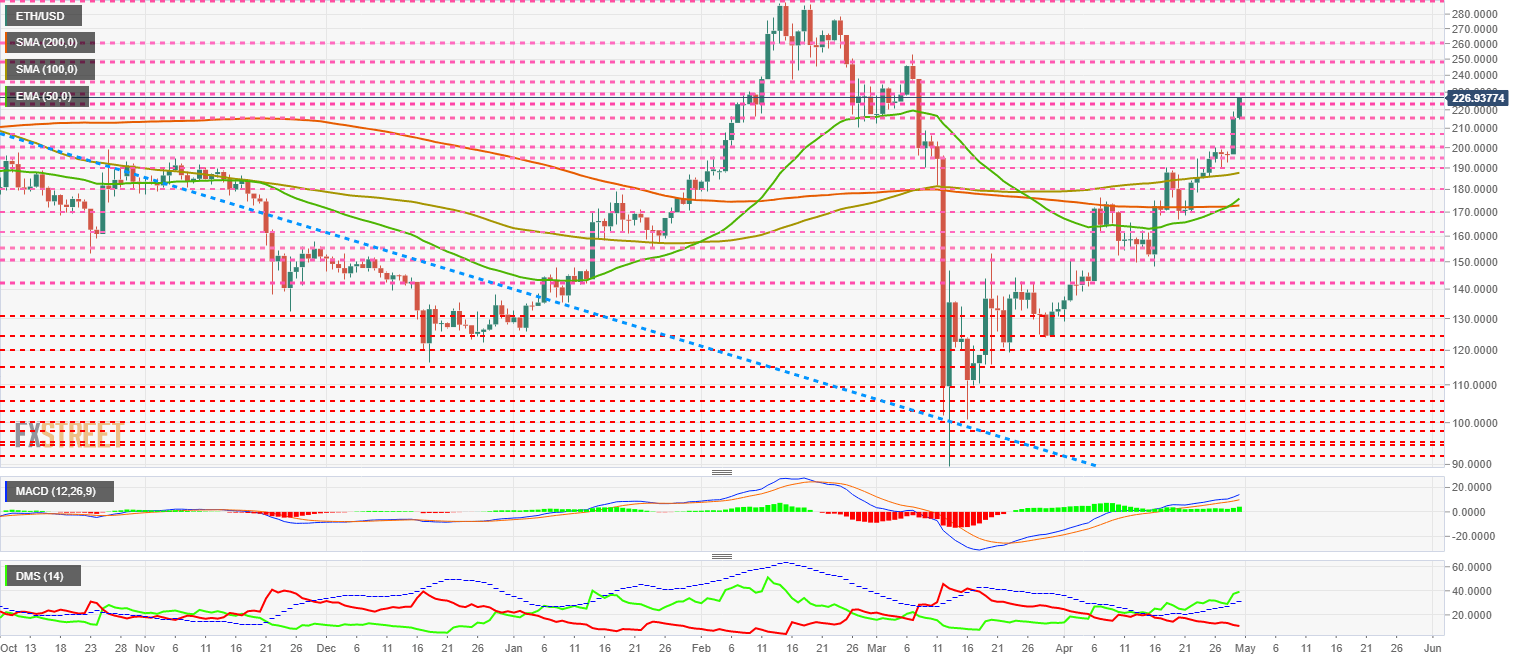
The DMI on the daily chart shows the bulls bouncing upwards after finding support at the ADX line. The bears are still down and show no interest in leading the pair.
XRP/USD Daily Chart
The XRP/USD pair is currently trading at the price level of $0.234 and is above the 200-day simple moving average. Now the price is in a much more optimal scenario for the development of bullish scenarios.
It is shocking to see the XRP/USD pair moving so smoothly for what is typical for the Ripple. Let's hope this is a sign of maturity.
Above the current price, the first resistance level is at $0.238, then the second at $0.254 and the third one at $0.268.
Below the current price, the first support level is at $0.23, then the second at $0.21 and the third one at $0.20.
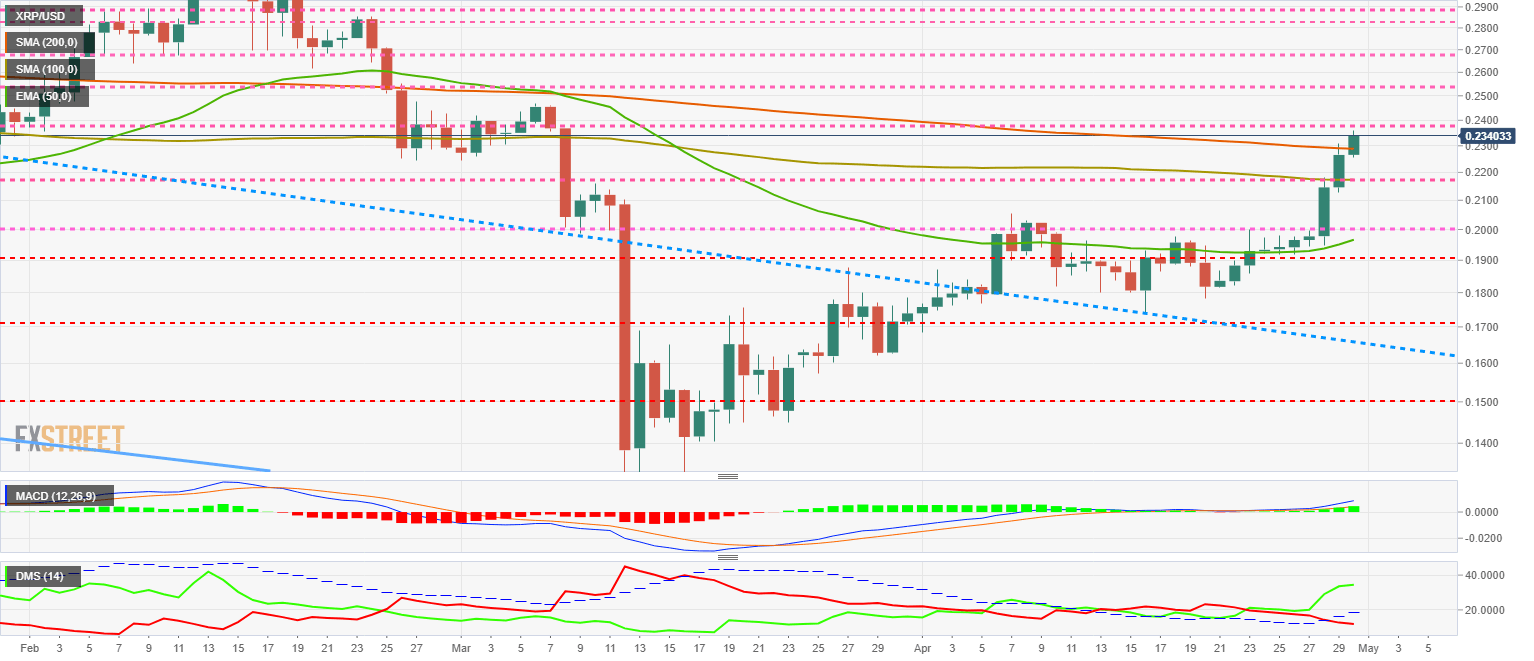
The MACD on the daily chart shows a significant improvement, both in terms of upward slope and distance between the lines. The increase in the bullish profile does not have the magnitude of the BTC/USD pair, which could lead to lower volatility levels.
The DMI on the daily chart shows bulls with a significant advantage over the bears, although the lack of speed in the price keeps the ADX low and dangerous for the indicator structure.
Author

Tomas Salles
FXStreet
Tomàs Sallés was born in Barcelona in 1972, he is a certified technical analyst after having completing specialized courses in Spain and Switzerland. He expanded his technical training following the guidance of great experts on the financial markets.