Top 3 Price Prediction Bitcoin, Ethereum, Ripple: Pioneer crypto to retrace briefly while altcoins go higher
- Bitcoin price might retreat to $56,000 as investors continue to book profit.
- Ethereum price also prepares for a sub-$4,000 pullback.
- Ripple price edges closer to a breakout from a bullish pennant pattern.

Bitcoin price continues to move sideways above a crucial psychological level. As long as support holds, BTC is in no trouble, however, if it breaks lower, it will likely drag Ethereum and Ripple along with it. Although this descent is likely to play out in the short term, it may be required to start a second leg-up.
Bitcoin price needs to correct
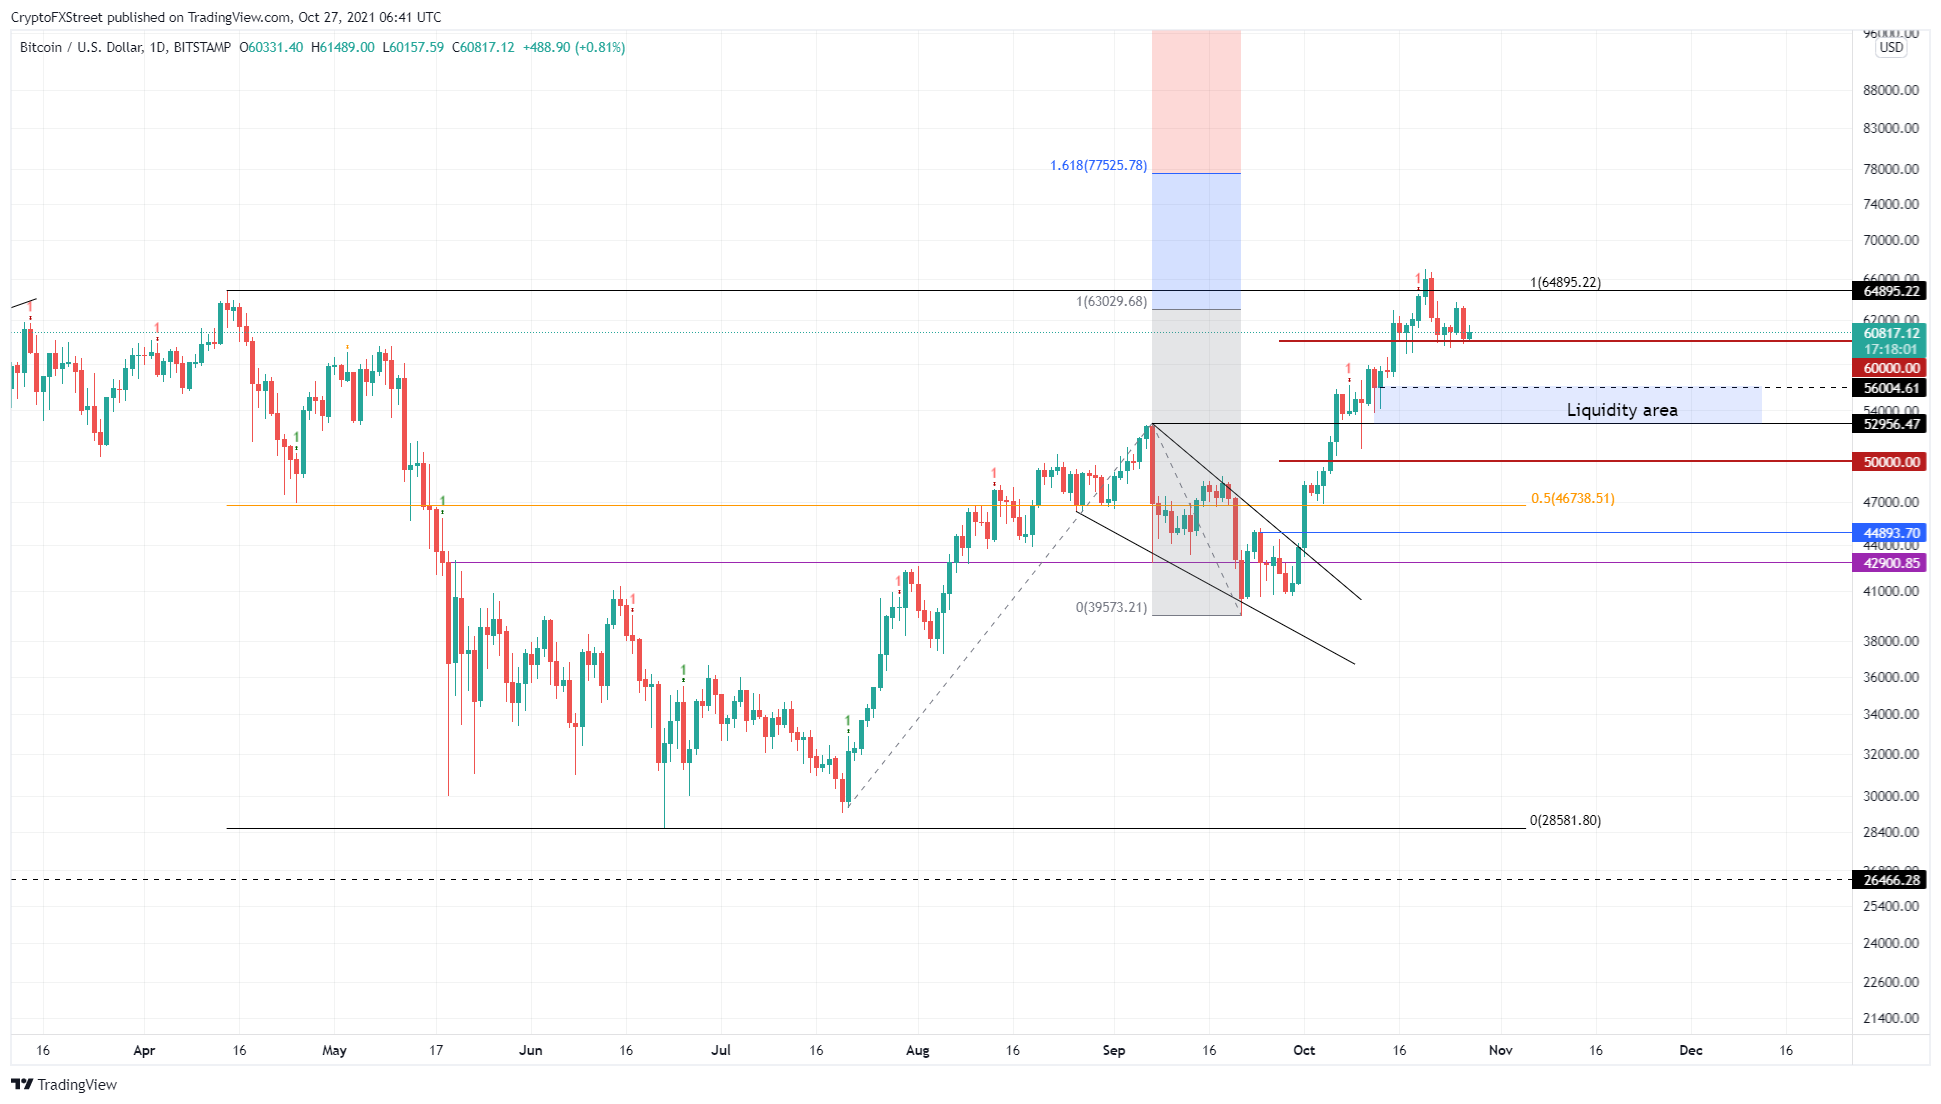
Bitcoin price is stuck producing lower highs and lower lows since rolling over at the October 21 $67,016 swing all-time high. While this pullback is currently stabilizing above the $60,000 support level, a breakdown could exacerbate the downswing and knock BTC down to the liquidity area, ranging from $52,595 to $56,004.
A dip into this zone will provide an opportunity for the sidelined buyers to jump on the bandwagon for the next leg-up. It will also allow investors to book profits, creating a double pressure of sorts. When this development reaches an inflection point, BTC will trigger a new bull run.
As for the upside, Bitcoin price will first encounter the $70,000 psychological level. Clearing this barrier will open the path to retest the 161.8% trend-based Fibonacci extension level at $77,525, a new all-time high.
BTC/USD 1-day chart
While things are looking up for the big crypto, a breakdown of the liquidity area’s lower limit at $52,956 will put Bitcoin price in a tough spot. While this move does not invalidate the bullish thesis, it will delay it.
In such a case, BTC might revisit $50,000 before restarting the uptrend.
Ethereum price climbs steadily
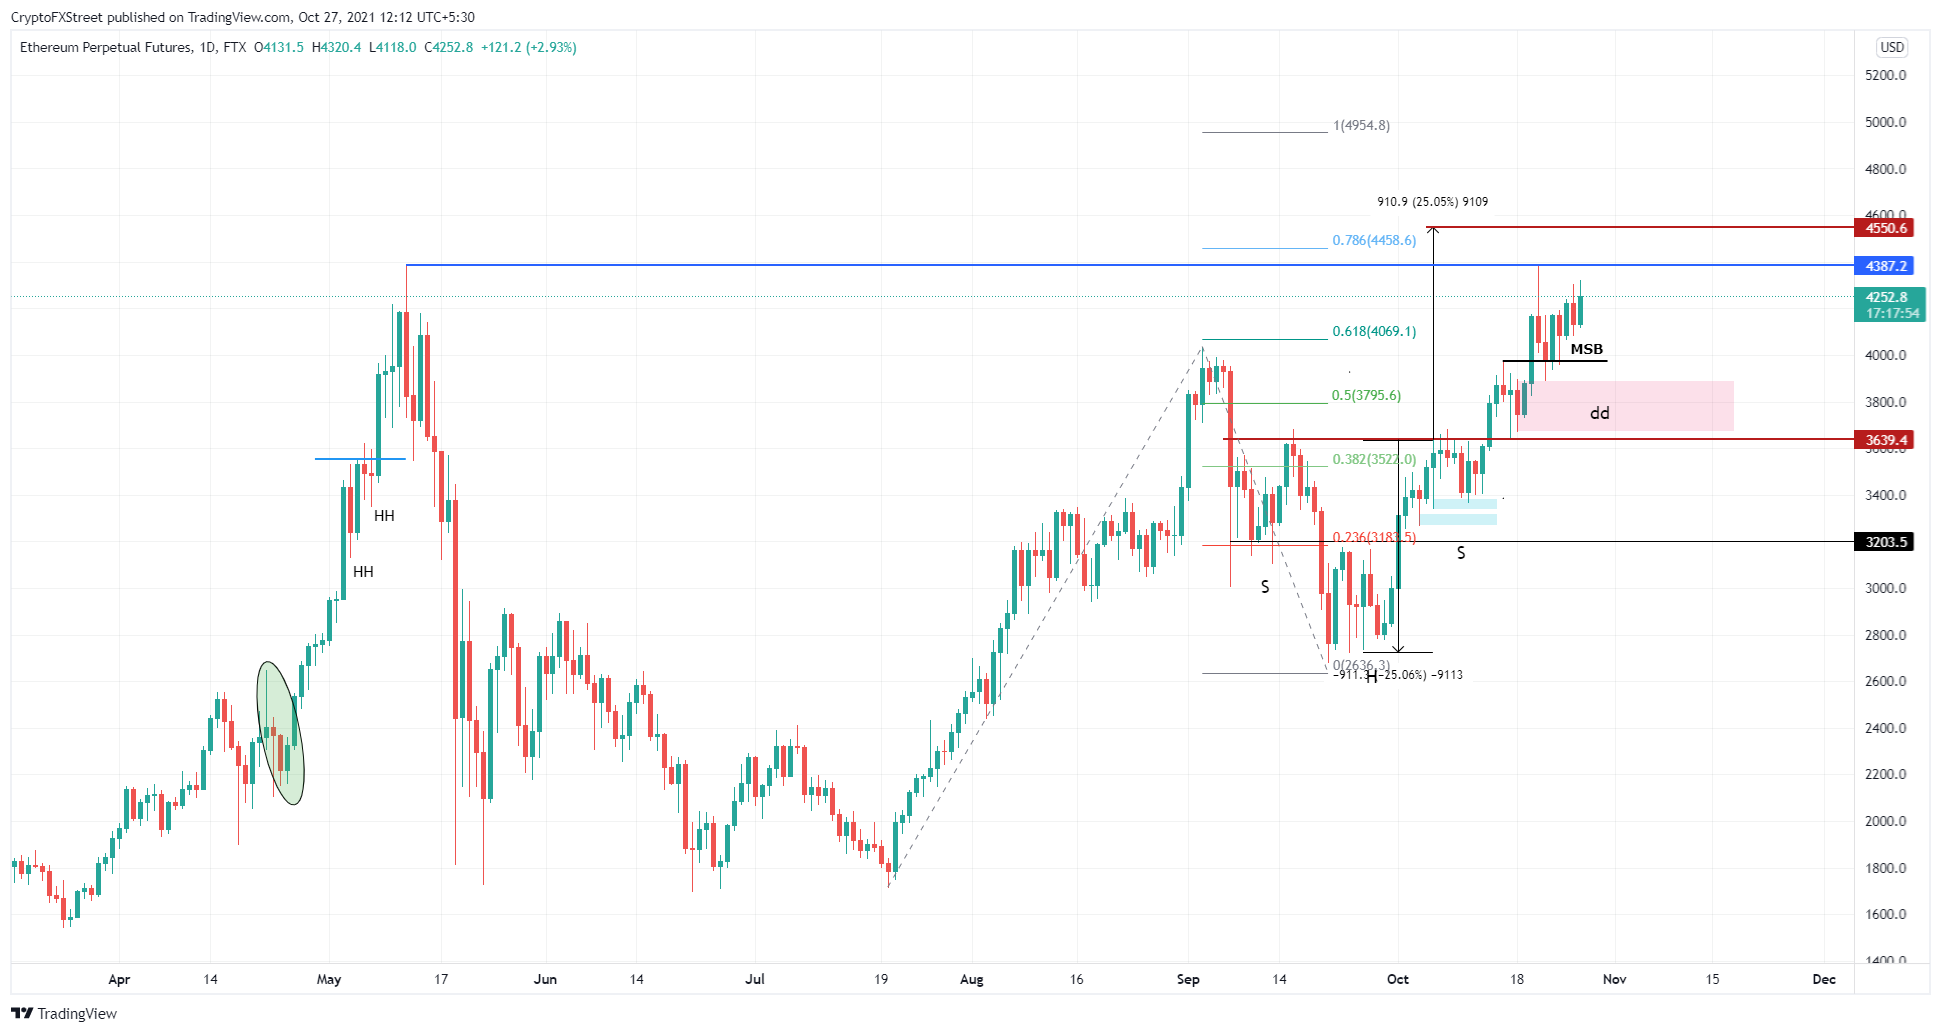
Ethereum price has been trading against Bitcoin’s trend lately. While BTC dropped since October 20, ETH slowly continued to climb higher. Even now, Ethereum price is currently edging closer to retest the all-time high at $4,387.
Moreover, an inverse head-and-shoulders pattern on ETH targets a 25% rally to just beyond the high at $4,550. Investors can expect ETH to retest either of these barriers if the trend continues. What’s more, if the smart contract token sees a spike in buying pressure, it is likely to reach the 100% trend-based Fibonacci extension level at $4,954.
ETH/USD 1-day chart
Although things might seem slow for Ethereum price, a breakdown of the $3,975 support floor will create a lower low and suggest a delayed bullish outlook.
In such a case, ETH might experience a short-term correction to the $3,675 to $3,889 demand zone.
Ripple price awaits a breakout
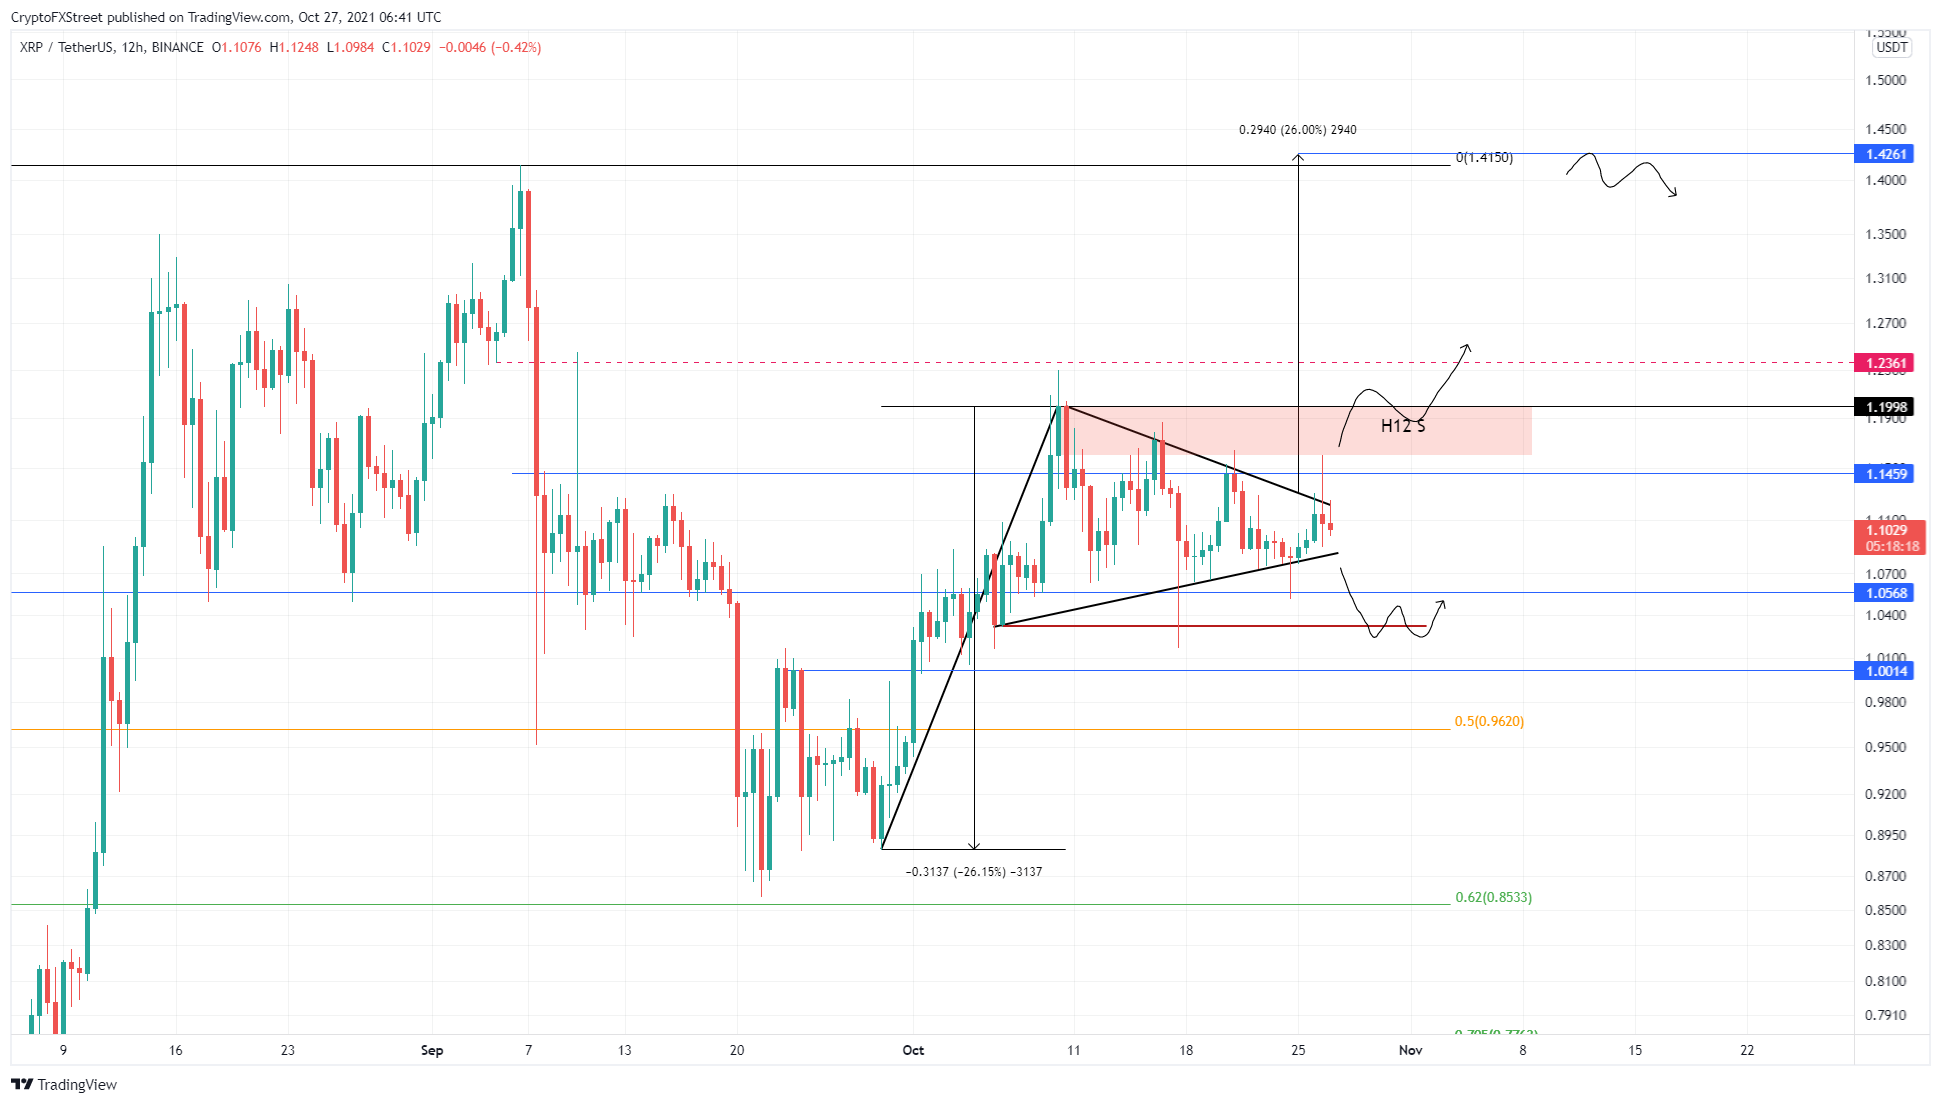
Ripple price is getting squeezed inside a bullish pennant pattern, which indicates an optimistic outlook. A decisive close above $1.14 will confirm a breakout from the pattern and subsequent rally.
In such a case, the XRP price is due for a 26% ascent to $1.43. While this move might seem straightforward, it is not. Ripple needs to flip the $1.2 resistance barrier into a support floor. Clearing this hurdle will open the path to the intended target at $1.43.
Investors should be aware that if the big crypto slips past the $60,000 psychological level, altcoins in general, including XRP, are likely to tumble.
XRP/USD 1-day chart
If XRP price produces a decisive close below $1.06, it will invalidate the bullish thesis and trigger a further descent to $0.96, coinciding with the 50% Fibonacci retracement level.
In a highly bearish case, Ripple might revisit the $0.85 support floor.
Author

Akash Girimath
FXStreet
Akash Girimath is a Mechanical Engineer interested in the chaos of the financial markets. Trying to make sense of this convoluted yet fascinating space, he switched his engineering job to become a crypto reporter and analyst.



