Top 3 Price Prediction Bitcoin, Ethereum, Ripple: Patience is a virtue as crypto rally gets underway
- Bitcoin price is still sideways as consolidation continues, with bulls awaiting the right moment to strike.
- Ethereum price stays in a bearish triangle that could hold an upside surprise if bulls play their cards right.
- XRP price starts to tilt in favour of bulls as the price action stays underpinned and buyers defend.

Bitcoin price, Ethereum and other cryptocurrencies are waiting to catch the right train that will bring a nice firm rally going into the summer of 2022. The start of the move looks to be delayed, however, as global markets flip-flop back and forth between risk-on and risk-off. The battle comes as bears push for lower prices on the back of a worldwide recession scenario whilst bulls want to buy the dip of a recovery trade once inflation fades. With the clashing of these two forces cryptocurrencies are in a spin. Overall, bullish pressure looks to be mounting, however, as dips get bought, and consolidations are set for a breakout higher moving forward.
Bitcoin price set to jump above $32,650
Bitcoin (BTC) price sees its price action being underpinned around $30,000 as, although price broke below in the past few days, the close above on Wednesday and the opening above this morning is a promising sign going forward. Additionally a decoupling is starting to unfold as although stock markets are trading lower, the one-on-one correlation with crypto looks to be breaking down. With investors searching for a place to invest to get high yielding returns, cryptocurrency as an asset class looks set to return to favour both for hedge funds and investors.
BTC price is thus set to pop higher towards $31,321.98 again, as it did on previous days. The best proof would be for markets to close above the monthly pivot at $32,000. From there, the pivot can be used as a resting point for bulls to book some gains and reenter the trade. It could also be a place where those who missed the entry sub $30,000, can place their stops – just below the monthly pivot – before the rally jumps higher towards $34,000 and tests the 55-day SImple Moving Average (SMA) in the process.
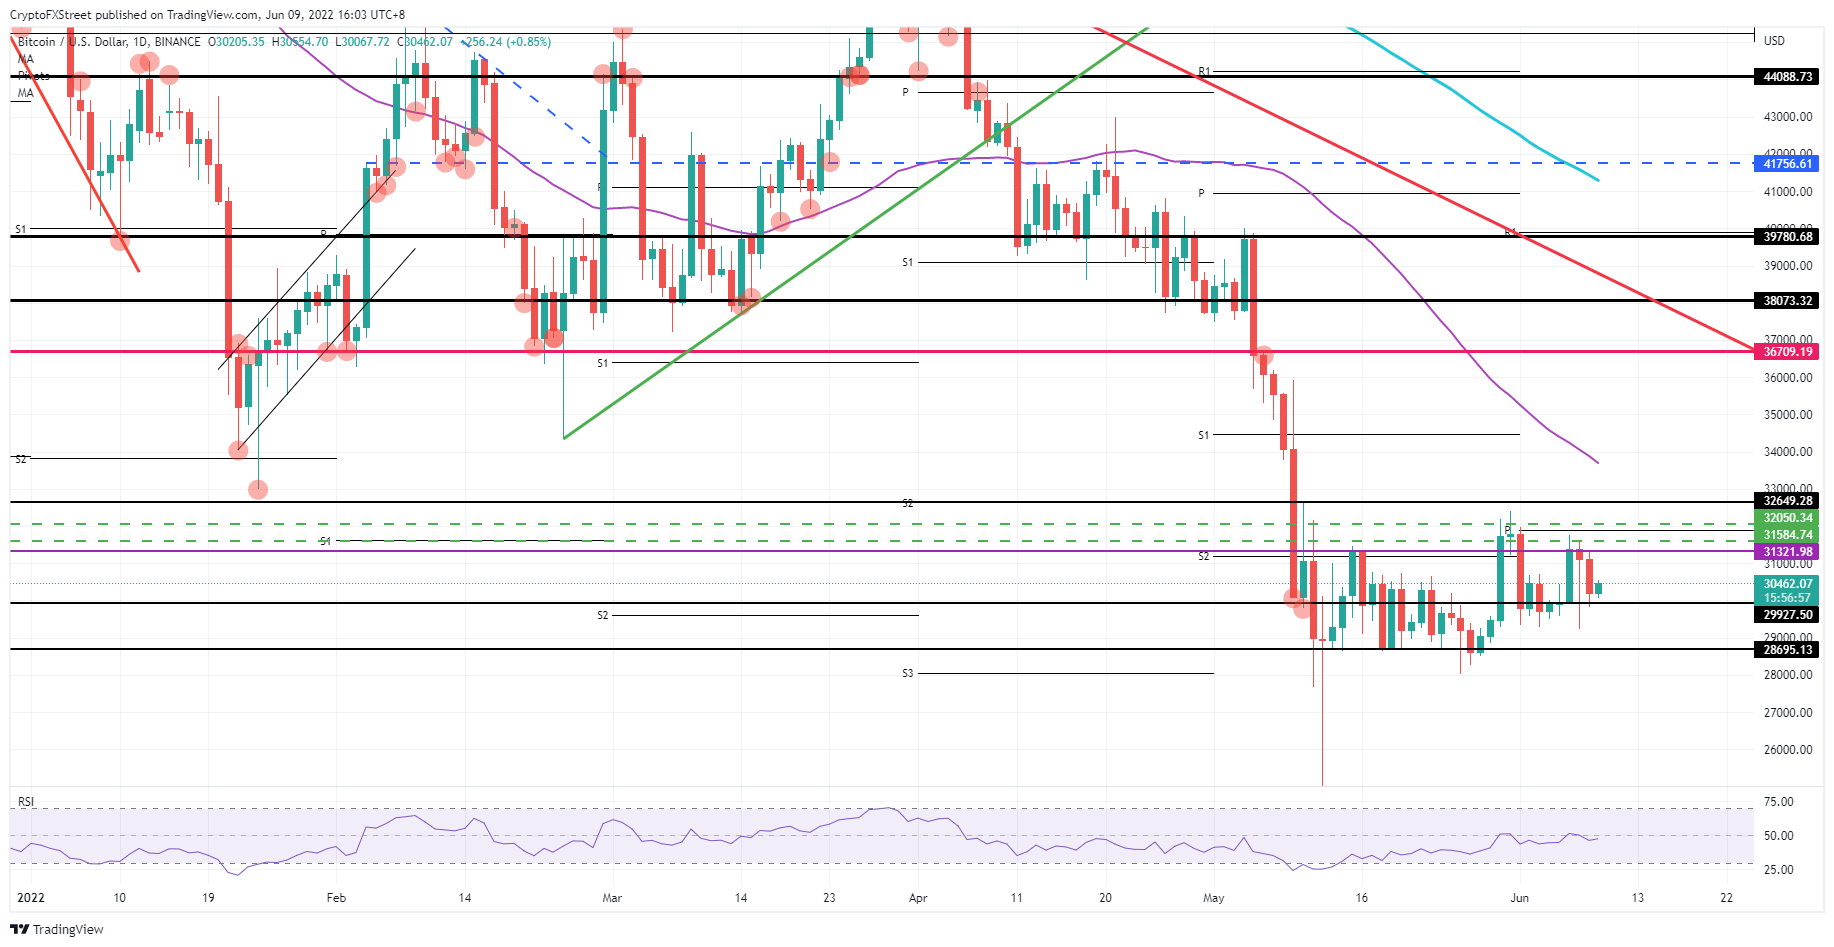
BTC/USD daily chart
Alternatively, with price action opening above $30,000, there could be a risk bears use a catalyst to run price action to the downside while using a headwind as support. That catalyst could be the European Central Bank decision today, where Lagarde could possibly disappoint markets if she commits to a prolonged and cautious rate hike path, which would be perceived as being too slow and not enough to tame inflation in the eurozone. Astronger dollar could be one of the repercussions from such an event, which in its turn could create a massive headwind for BTC price action and make it drop back towards $28,695.13 and possibly even see a short blip towards $28,000.
Ethereum price could see bulls not awaiting the completion of the triangle
Ethereum (ETH) price is trading within the ranges of a triangle formation that has been holding its grasp on price action for a couple of weeks now. Although it is still far from completing, with a possible breakout in July, nothing forbids bulls from making an earlier run for it. Price action is clearly underpinned by bulls scooping up every possibility of getting in beforehand, even above the triangle’s baseline. Certainly, the $1,720 level looks to be doing just that.
ETH price could thus see a bullish breakout sooner rather than later as the Relative Strength Index (RSI) remains elevated, despite the two down days on Wednesday and Tuesday.. Expect to see a jump towards $1,928.89, which would be right at the intersection with the sloping side of the triangle. If ETH price action can make it beyond that inflection point, then a full stretch of the rally could occur towards $2,200, with the monthly pivot, and the $2,148.67 level just below, acting as a double cap to the upside.
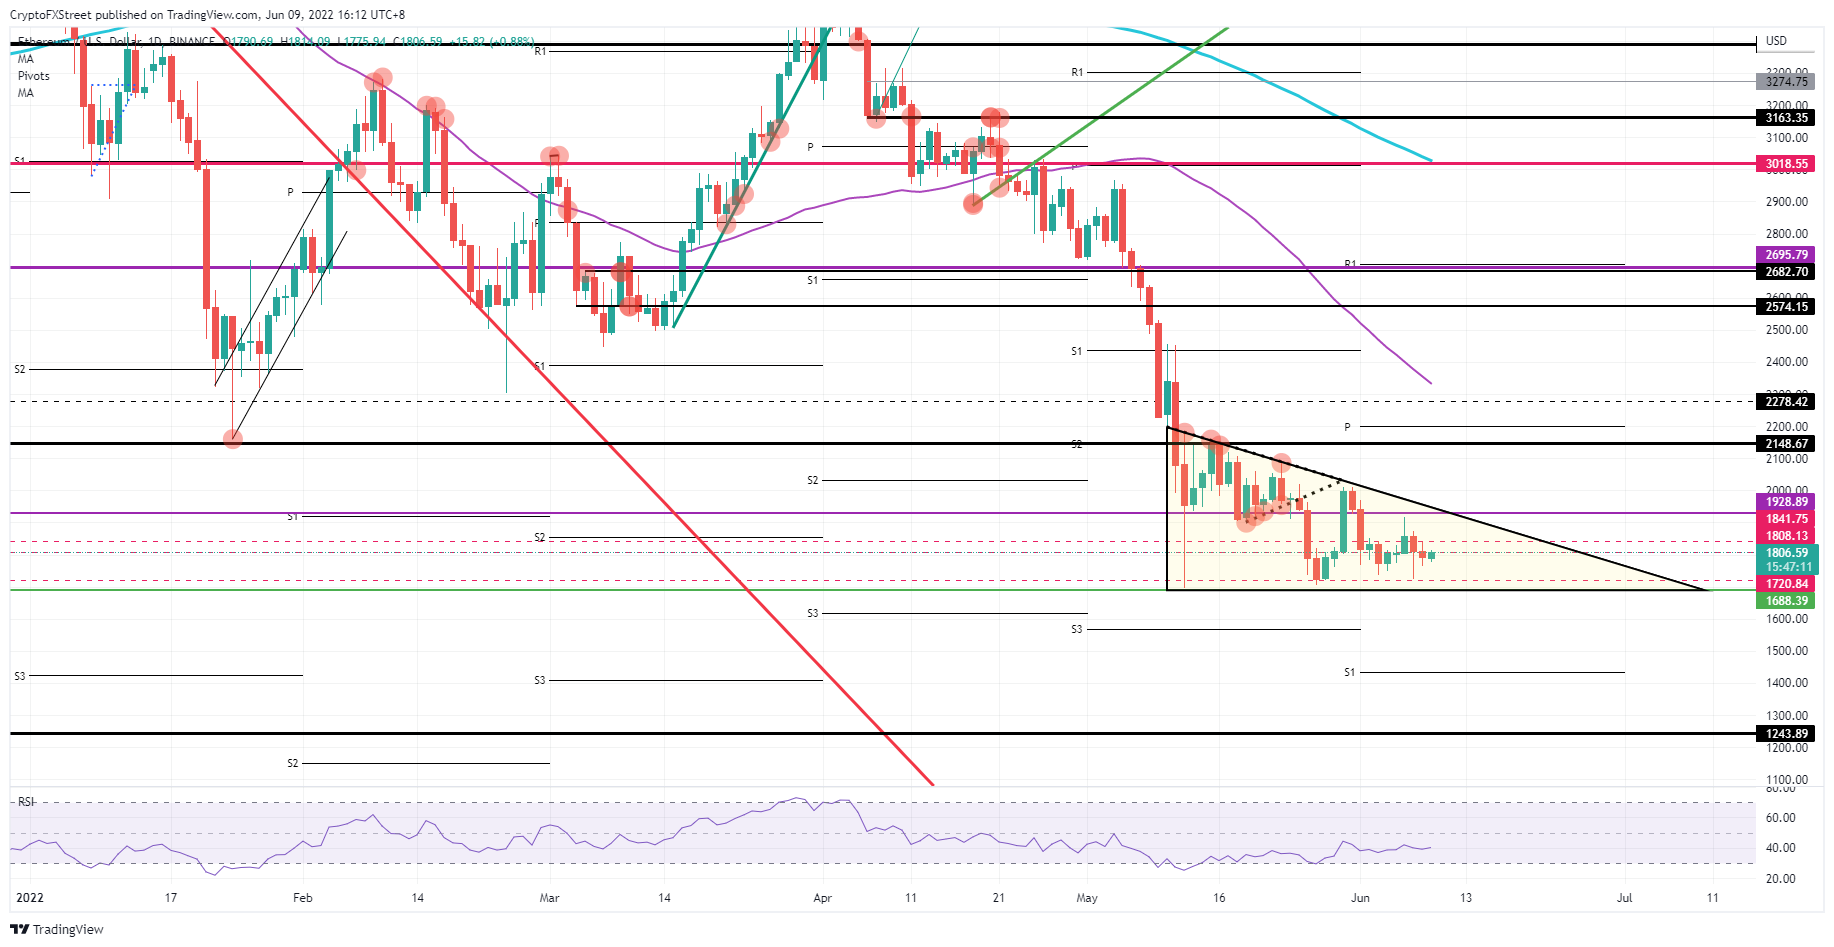
ETH/USD daily chart
The risk to this bullish outlook is that the triangle remains, plain and simple, a bearish triangle, and that that is precisely how it plays out when the triangle reaches its breakout point somewhere in July. A break to the downside would result from a penetration below $1,688 which would then trigger a new low for 2022. The monthly S1 at $1,434 would then be the first real identified support level that could be used to halt the descent. That is still a sharp 15% decline yet again from the already battered price action for 2022 in Ethereum.
XRP price looking bullish as long as $0.38 holds
Ripple (XRP) price action is almost a direct copy and paste of Bitcoin price, which,along with similar patterning also stays underpinned at $0.38. This support level is fundamental in the short-term to determine if a rally could be happening anytime soon. With price action underpinned, the logic is that bulls are still buying and are not letting loose on bears to overmatch their sell orders. As a result, eventually, price action should shoot up quite rapidly as bears start to give in and even turn around and start to buy XRP coins to take advantage of the market pivot.
XRP price could therefore be in for a treat with price action first popping above $0.4228 before trying to rally another leg higher, with some room to cross towards $0.48, making 20% gains in the covered area. The monthly pivot could throw a spanner in the works below that level if bears use it as an earlier entry point with their stops placed above that $0.48-handle. Depending on the tailwinds and catalysts, that could trigger another leg higher and $0.52 could be up for grabs.
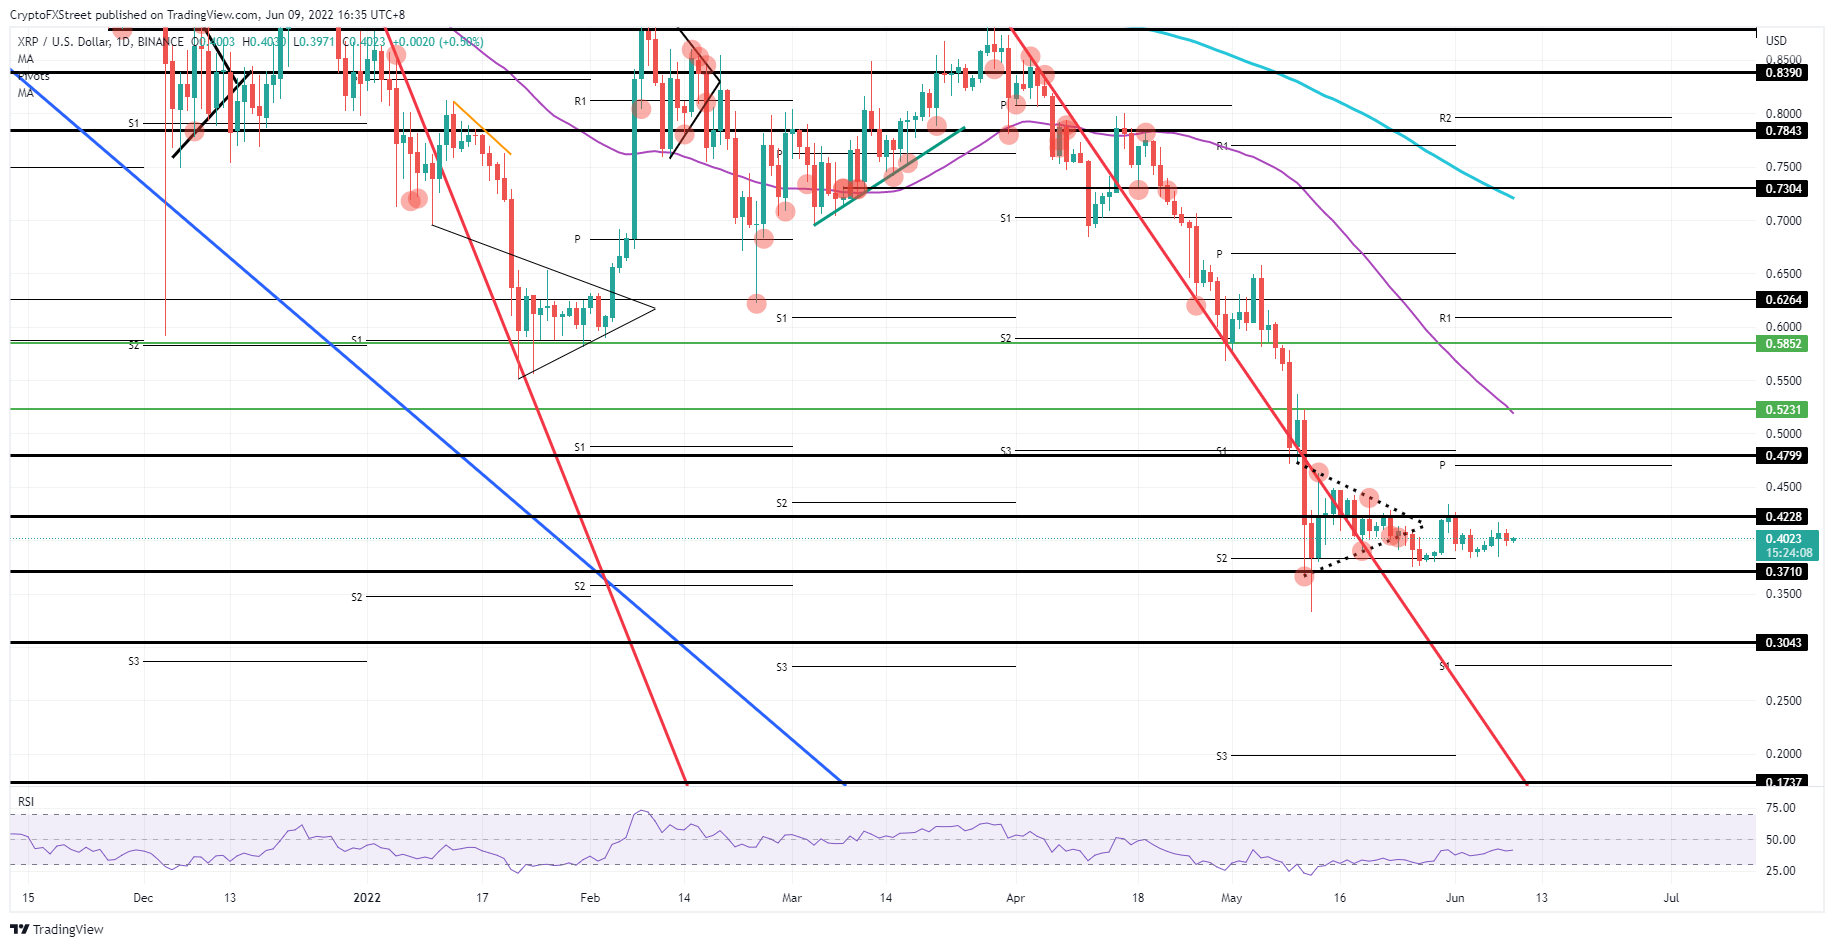
XRP/USD daily chart
A rejection by $0.42, however, could trigger a firmer drive lower and see bulls squashed against the $0.37 floor. With bulls’ stops placed just below, executing all those stops could trigger a quick blip towards $0.35 and open up room for bears to move XRP price action down towards $0.30. Translated into percentages from where XRP price is currently trading, that would mean another 20% losses added to the numbers for 2022.
Author

Filip Lagaart
FXStreet
Filip Lagaart is a former sales/trader with over 15 years of financial markets expertise under its belt.



