- Opposite technical signals blind the field of vision in a complex environment.
- Moving averages and price action point to declines in the short term.
- Technical indicators hint bullish crosses in the Top 3 cryptocurrencies.
The lack of price volatility acts contrarianly in the minds of active traders. A market moving in a narrow price range generates a lot of anxiety in traders.
This anxiety is not only because of the difficulty in finding the trade but also because of the lack of information about the future trend.
Today's session shows precisely this lack of volatility, with little movement, but hides an exciting technical moment that will define the market trend in the coming weeks.
The MACDs of the BTC/USD, ETH/USD and XRP/USD pairs are all aligned in a classic bullish cross structure, which should materialize before the end of the current week.
The behavior pattern of this indicator has some particularities when applied to the cryptocurrencies market.
- The pattern called "MACD failure" does not usually work when applied to Bitcoin or Ethereum. The bullish cross is given at the first attempt and not with a rejection at the first attempt.
- The pattern called "cross-test", which involves a test of the newly crossed line, is more pronounced and can even lead to new lows (or highs in the case of bear crosses) without undoing the cross.
As we will see in the detailed analysis of each pair, the most evident projection proposes an increase in volatility but with no visibility in the direction of the price.
ETH/BTC Daily Chart
The ETH/BTC pair is currently trading at the price level of 0.0202 and continues through the narrow space provided by the EMA50 and the SMA100.
If the situation does not change and volatility increases, ETH/BTC will encounter the long-term bearish trend at Christmas and that might not be a good gift.
A very flat price profile would have little chance of crossing the upward trend line, and if it did, it would be likely to slide down above the downward trend line.
Above the current price, the first resistance level is at 0.0207, then the second at 0.0218 and the third one at 0.0225.
Below the current price, the first support level is at 0.020, then the second at 0.0189 and the third one at 0.0180.
The MACD on the daily chart shows a very flat profile, in a slightly negative zone, hinting a move downwards. Right now the data is minimal due to the low volatility.
The DMI on the daily chart shows the bears losing strength at the same speed as the bulls gain it, but keeping the distances between them. The sellers continue to be in control.
BTC/USD Daily Chart
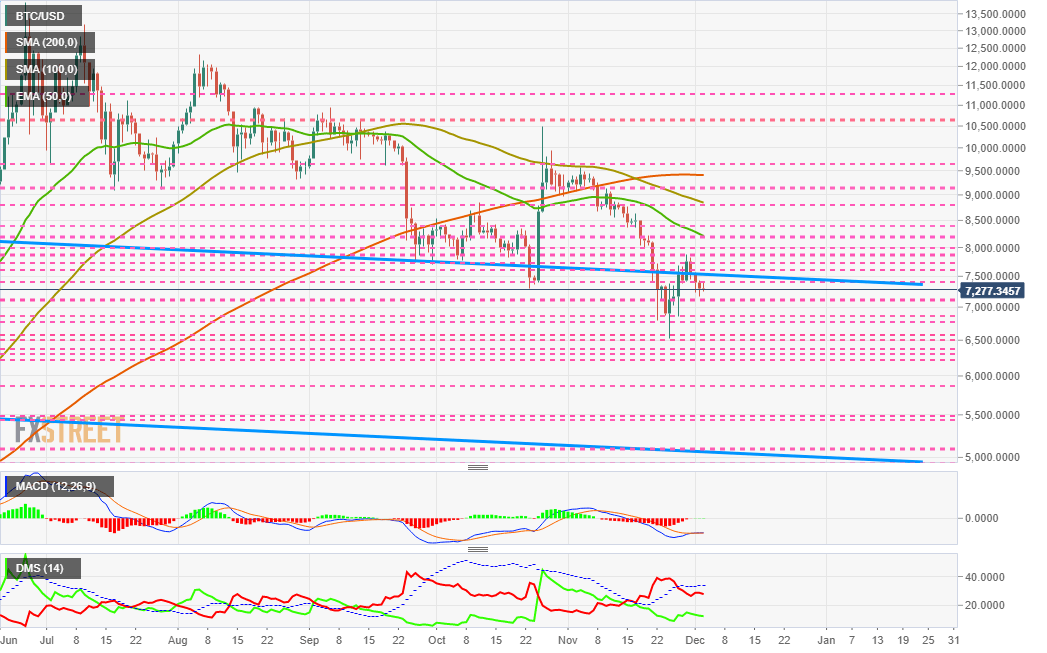
The BTC/USD pair is currently trading at the $7.277 price level. Technically the situation is complex.
As a bearish argument, we see the BTC/USD pair within the long-term bearish channel, a scenario that could develop up to the $5,000 price level.
As a bullish argument, the indicators show compelling bullish turning patterns.
Any solution to the current situation implies a drastic increase in volatility.
Above the current price, the first resistance level is at $7,400, then the second at $7,600 and the third one at $7,750.
Below the current price, the first support level is at $7,100, then the second at $6,850 and the third one at $6,750.
The MACD on the daily chart shows an evolving bullish cross. Bearing in mind the particularities of the MACD applied to the BTC/USD pair, we can expect an increase in volatility but with little visibility of direction in the short term.
The DMI on the daily chart shows how the bears continue to lose strength, although the bulls do not increase it to the same extent.
ETH/USD Daily Chart
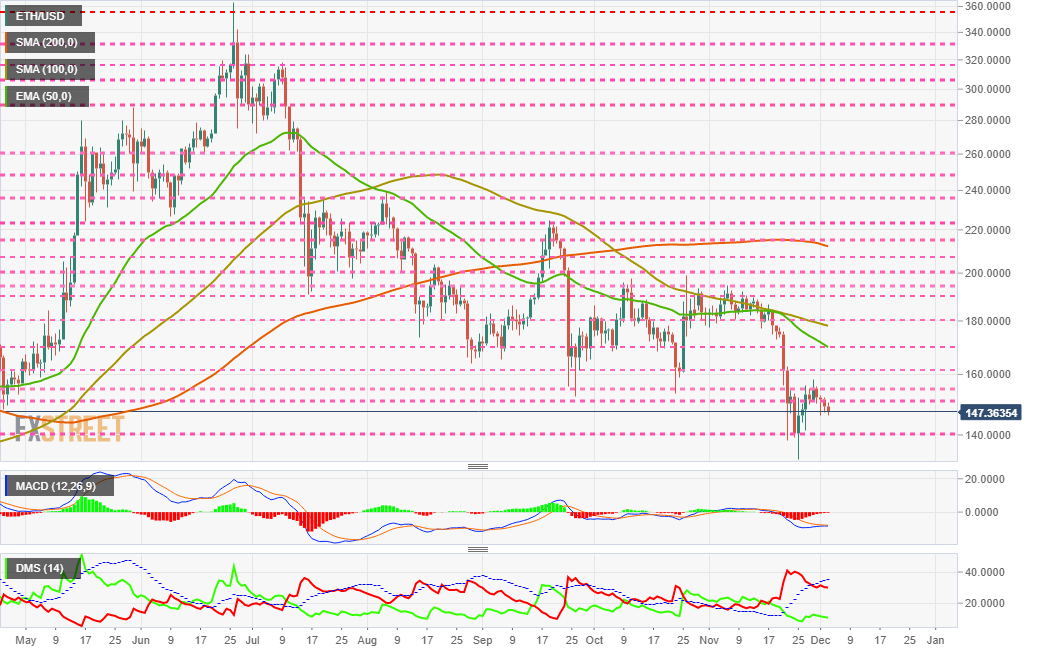
ETH/USD is currently trading at $147.3 and appears to be moving away from the $150 resistance level. The technical situation of the ETH/USD is as ambiguous as that of the BTC/USD.
Moving averages have firm bearish profiles, while indicators show visible bullish cutting patterns.
We can expect an increase in volatility in the short term, but with no visibility to the direction of the price.
Above the current price, the first resistance level is at $150, then the second at $155 and the third one at $160.
Below the current price, the first support level is at $140, then the second at $130 and the third one at $125.
The MACD on the daily chart shows a bullish cross developing. The particular behavior of this indicator applied on a crypto-asset supports a scenario of increasing volatility but with a lack of visibility on the direction.
The DMI on the daily chart shows how the bears continue to lose strength, while the bulls give up the fight for leadership and retreat.
XRP/USD Daily Chart
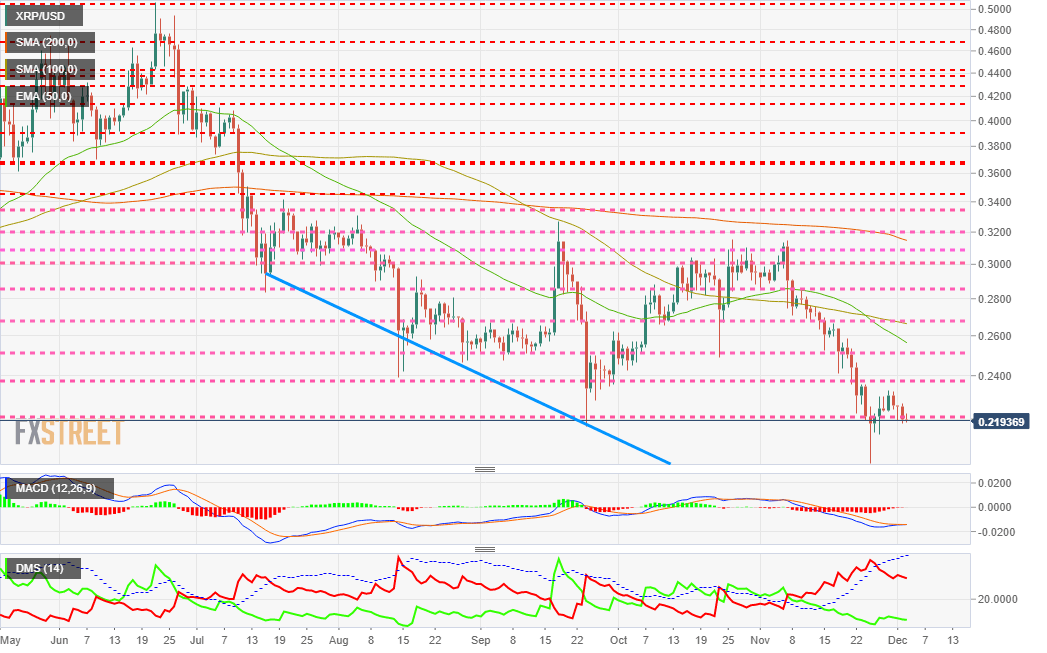
XRP/USD is currently trading at the $0.219 price level and loses the $0.22 support level. Below the current price, the XRP/USD pair is in danger of significant declines due to the lack of density of support levels.
Above the current price, the first resistance level is at $0.22, then the second at $0.24 and the third one at $0.251.
Below the current price, the first support level is at $0.19, then the second at $0.17 and the third one at $0.15.
The MACD on the daily chart shows the same profile it has on the BTC/USD and ETH/USD pairs. It proposes an increase in volatility but with little visibility in the direction of the price in the short term.
The DMI on the daily chart shows the bears losing strength, while the bulls give up taking advantage of this weakness and also lose power.
Get 24/7 Crypto updates in our social media channels: Give us a follow at @FXSCrypto and our FXStreet Crypto Trading Telegram channel
Information on these pages contains forward-looking statements that involve risks and uncertainties. Markets and instruments profiled on this page are for informational purposes only and should not in any way come across as a recommendation to buy or sell in these assets. You should do your own thorough research before making any investment decisions. FXStreet does not in any way guarantee that this information is free from mistakes, errors, or material misstatements. It also does not guarantee that this information is of a timely nature. Investing in Open Markets involves a great deal of risk, including the loss of all or a portion of your investment, as well as emotional distress. All risks, losses and costs associated with investing, including total loss of principal, are your responsibility. The views and opinions expressed in this article are those of the authors and do not necessarily reflect the official policy or position of FXStreet nor its advertisers. The author will not be held responsible for information that is found at the end of links posted on this page.
If not otherwise explicitly mentioned in the body of the article, at the time of writing, the author has no position in any stock mentioned in this article and no business relationship with any company mentioned. The author has not received compensation for writing this article, other than from FXStreet.
FXStreet and the author do not provide personalized recommendations. The author makes no representations as to the accuracy, completeness, or suitability of this information. FXStreet and the author will not be liable for any errors, omissions or any losses, injuries or damages arising from this information and its display or use. Errors and omissions excepted.
The author and FXStreet are not registered investment advisors and nothing in this article is intended to be investment advice.
Recommended Content
Editors’ Picks
Coinbase lists WIF perpetual futures contract as it unveils plans for Aevo, Ethena, and Etherfi

Dogwifhat perpetual futures began trading on Coinbase International Exchange and Coinbase Advanced on Thursday. However, the futures contract failed to trigger a rally for the popular meme coin.
Stripe looks to bring back crypto payments as stablecoin market cap hits all-time high

Stripe announced on Thursday that it would add support for USDC stablecoin, as the stablecoin market exploded in March, according to reports by Cryptocompare.
Ethereum cancels rally expectations as Consensys sues SEC over ETH security status

Ethereum (ETH) appears to have returned to its consolidating move on Thursday, canceling rally expectations. This comes after Consensys filed a lawsuit against the Securities & Exchange Commission (SEC) and insider sources informing Reuters of the unlikelihood of a spot ETH ETF approval in May.
FBI cautions against non-KYC Bitcoin and crypto money transmitting services as SEC goes after MetaMask

US Federal Bureau of Investigations (FBI) has issued a caution to Bitcoiners and cryptocurrency market enthusiasts, coming on the same day as when the US Securities and Exchange Commission (SEC) is on the receiving end of a lawsuit, with a new player adding to the list of parties calling for the regulator to restrain its hand.
Bitcoin: BTC post-halving rally could be partially priced in Premium

Bitcoin (BTC) price briefly slipped below the $60,000 level for the last three days, attracting buyers in this area as the fourth BTC halving is due in a few hours. Is the halving priced in for Bitcoin? Or will the pioneer crypto note more gains in the coming days?


