Top 3 Price Prediction Bitcoin, Ethereum, Ripple: Market points to a twist in the road
- Major EU members are calling for the protection of sovereignty against initiatives such as Libra.
- Strong divergences emerge in the ETH/BTC chart, risking Ethereum's good timing.
- Ripple looking to outperform its Top 3 peers.

The European Union will provide strict regulation of the role of stable currencies at the request of five important club members. Germany, France, Italy, the Netherlands and Spain have urgently requested that the European Commission establish a rigid regulation on digital coins anchored to fiat coins.
With a focus on Facebook's Libra project, the petition submitted by the states mentioned above calls for legislation to safeguard the power of the European Central Bank as a guarantor of monetary control.
With arguments such as "prevention of money laundering" or "use in illicit activities", European legislators demand to ban the implementation of stable digital currencies until a community legislative framework is approved.
According to Reuters, German Finance Minister Olaf Scholz has stated that "we agree that it is our task to maintain stability in the financial market and to ensure that what is the task of the states remains the task of the states".
From the technical point of view, the chart of Bitcoin's dominance continues to show a favourable structure for Bitcoin to regain market share. The proximity of the price to the base of the bearish channel and the divergent congestion structure in the MACD point in that direction.
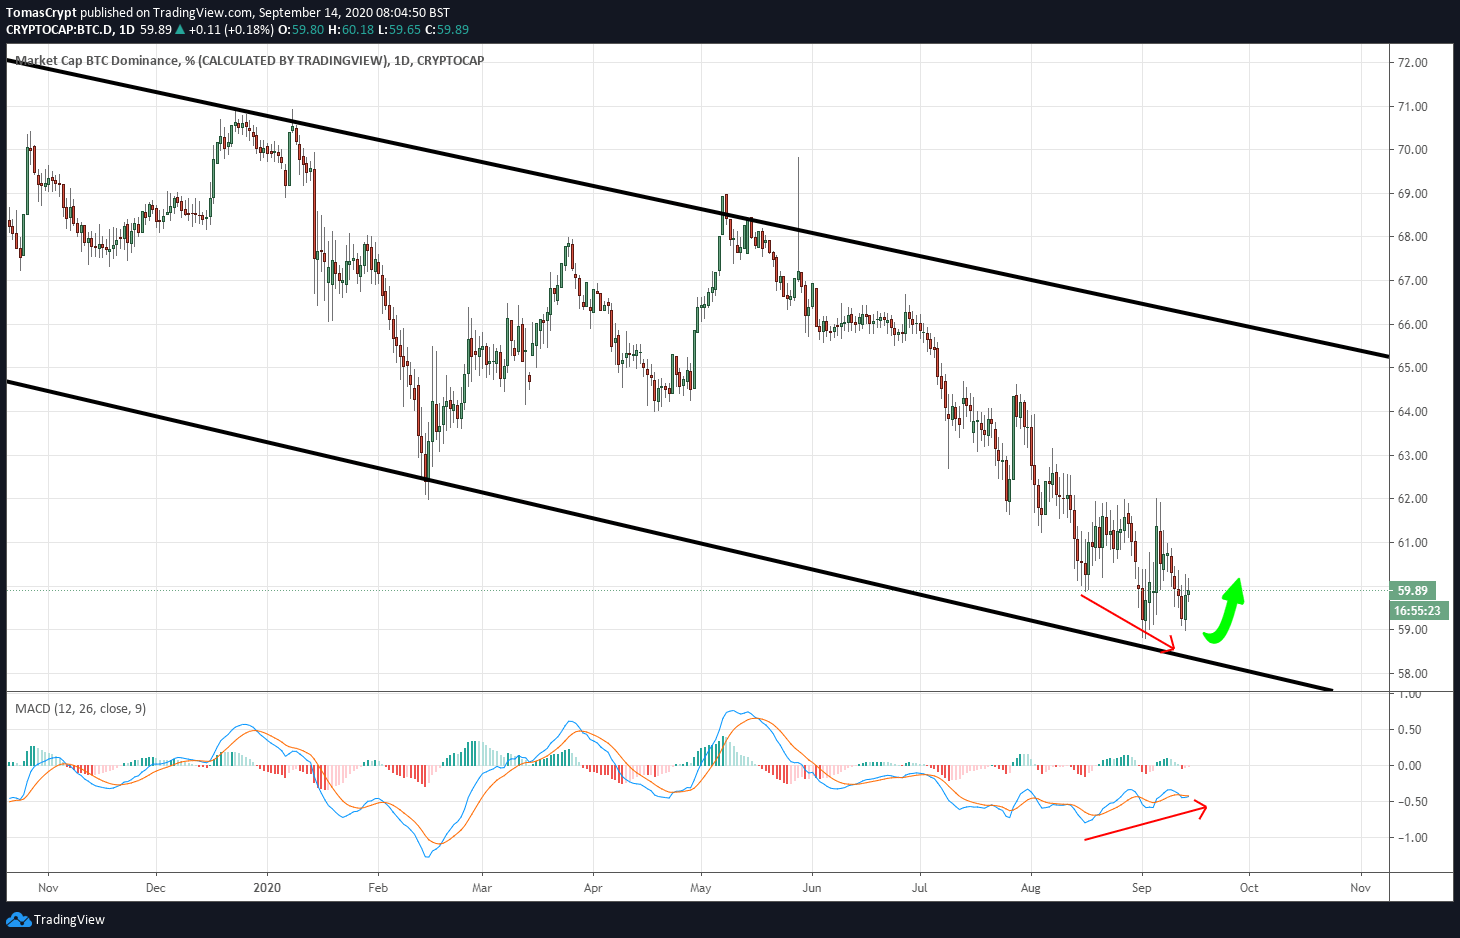
The members of the Top 3 respect the tradition and remain numb the momentum of the market as they approach a decisive moment.
Technical indicators have been slowly moving towards the critical moment that shows the way forward for the price for the next trading sessions.
Both the MACD indicator and the composite indicator of trend forces DMI (Directional Movement Index) present stressed structures.
ETH/BTC Daily Chart
The ETH/BTC pair is currently trading at 0.0354 and remains within the range of recent weeks. Technical indicators are showing strong divergences with the price, as I explain in the section below.
Above the current price, the first resistance level is at 0.0372, then the second at 0.040 and the third one at 0.0414.
Below the current price, the first support level is at 0.0348, then the second at 0.0328 and the third one at 0.0315.
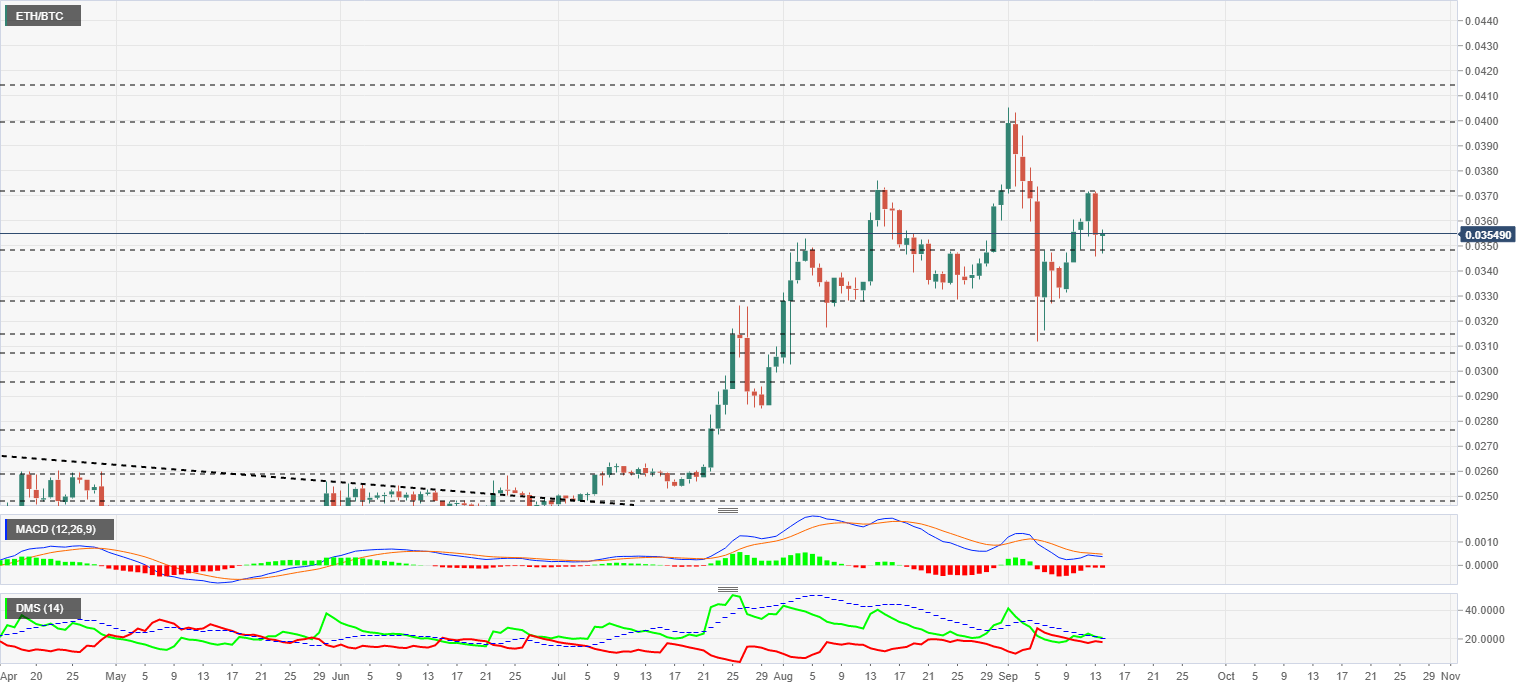
The MACD on the daily chart shows the effect of this weekend's failed upward attempt. Now the structure has weakened and the possibilities for a further downward movement have increased. On the positive side for Ethereum, the moving averages that make up the MACD are still above the 0 levels, which would support Ether.
The DMI on the daily chart shows a significant divergence with the ETH/BTC price movement. Since the beginning of the last bullish stretch in mid-July, bears have been increasing in strength as bulls have gradually lost the vigour of the early days. The risk for Ethereum to lose positions to Bitcoin is high in the short term.
BTC/USD Daily Chart
The BTC/USD pair is currently trading at $10374 after being unable to consolidate above the price congestion resistance of $10450.
Above the current price, the first resistance level is at $10450, then the second at $11075 and the third one at $11360.
Below the current price, the first support level is at $10000, then the second at $9800 and the third one at $9470.
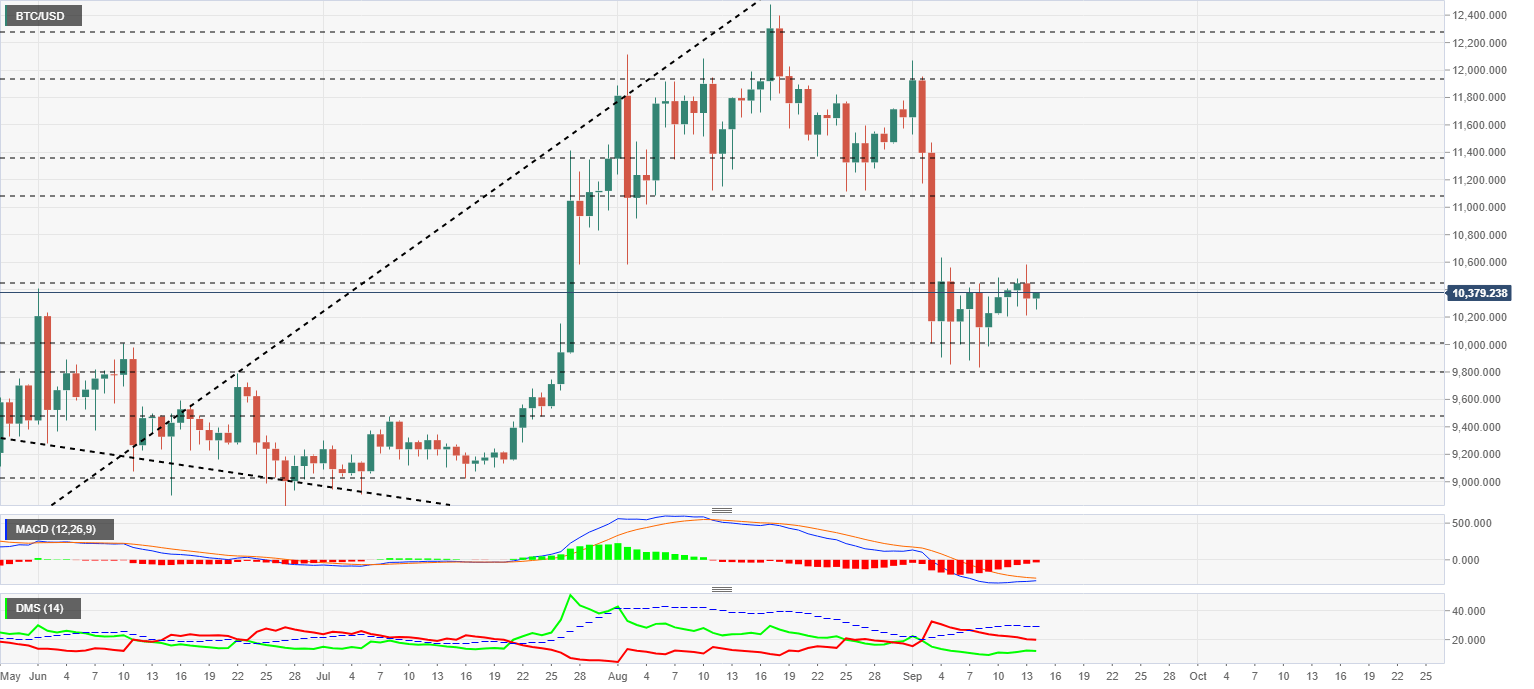
The MACD on the daily chart shows a profile that is looking for an upward cross, although the slope of the moving averages is not optimal due to the excessively flat shape they present. Alternative scenarios are a bearish rejection or a violent upward breakout.
The DMI on the daily chart shows bears controlling the pair while being closely followed by a buying side that has been improving over the past week.
ETH/USD Daily Chart
The ETH/USD pair is currently trading at the $365 price level after failing at the $390 barrier. The current corrective process left the relative low at the $320 price level, so a ride below $300 is over the table.
Above the current price, the first resistance level is at $390, then the second at $408 and the third one at $440.
Below the current price, the first support level is at $360, then the second at $335 and the third one at $315.
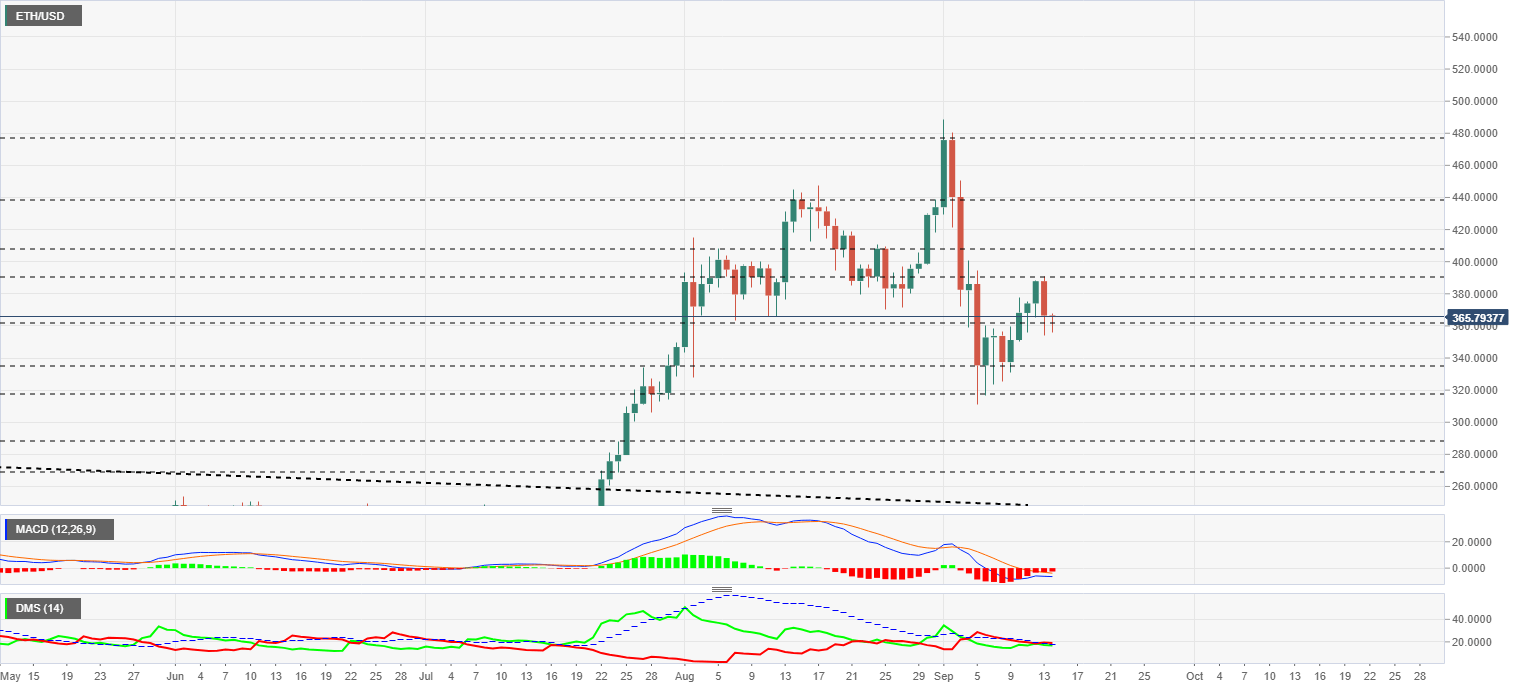
The MACD on the daily chart shows a structure that is prone to an upward cross although the excessively flat profile and the position below the 0 levels are against a possible upward movement.
The DMI on the daily chart shows bears and bulls coming face to face. For the moment, the sell-side has a slight advantage over the buyers.
XRP/USD Daily Chart
The XRP/USD pair is currently trading at the price level of $0.2452 and seeks to consolidate the price congestion support level at the price level of $0.24. This support level has gained strength in the presence of long-term trend lines.
Above the current price, the first resistance level is at $0.26, then the second at $0.276 and the third one at $0.295.
Below the current price, the first support level is at $0.235, then the second at $0.228 and the third one at $0.215.
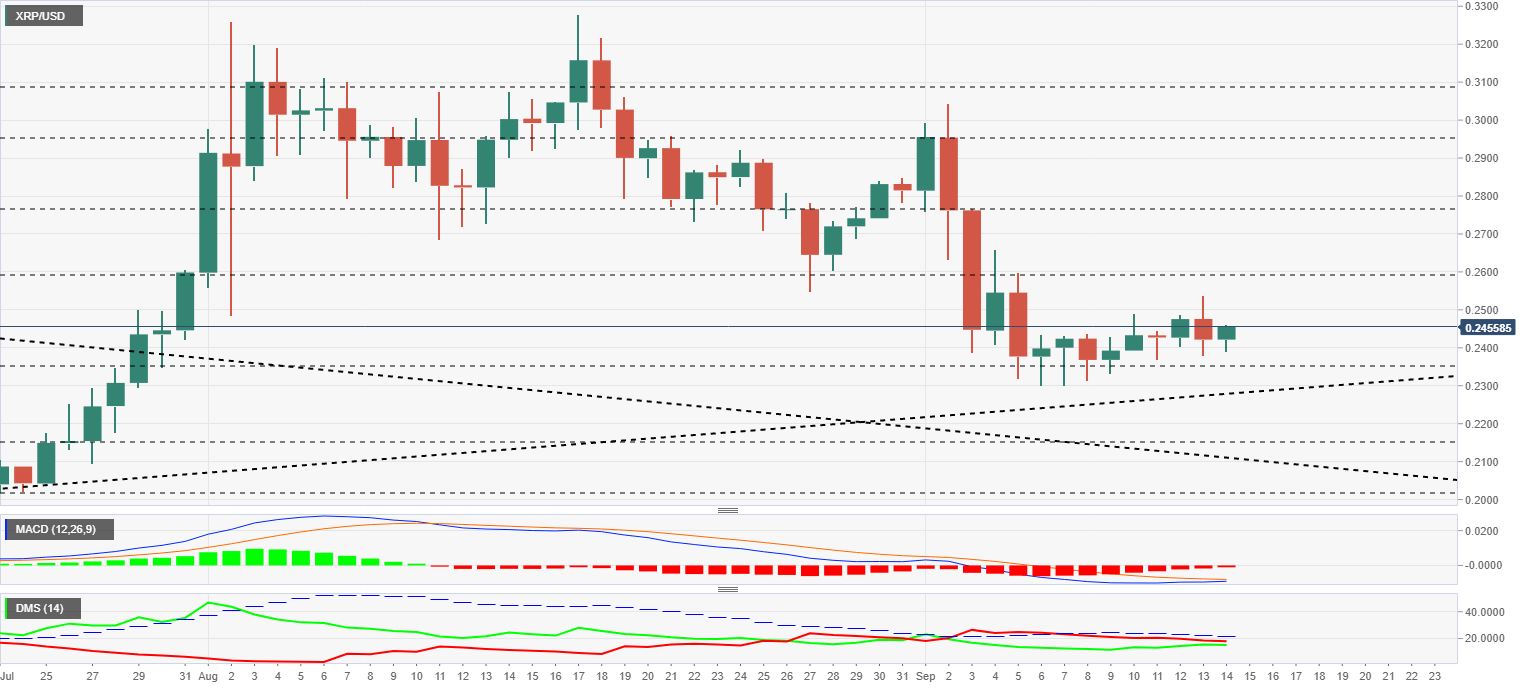
The MACD on the daily chart shows an optimal profile for a bullish cross. The MACD on the daily chart shows an optimal shape for a bullish cross. The moving averages that make up this indicator show a right upward slope to achieve the upward signal.
The DMI on the daily chart shows bears and bulls at similar levels. The selling side has lost strength over the past week, and if it does not change direction, it will lose its lead in the coming days.
Author

Tomas Salles
FXStreet
Tomàs Sallés was born in Barcelona in 1972, he is a certified technical analyst after having completing specialized courses in Spain and Switzerland. He expanded his technical training following the guidance of great experts on the financial markets.


