Top 3 Price Prediction Bitcoin, Ethereum, Ripple: In search of the Bitcoin anchorage
- Bitcoin is increasing its market share and amplifying its role as a store of value.
- Fear of the bubble in the DeFi segment may have contributed to this quest for quality.
- Fight for dominance again leads to a change of direction in the market.

When the gates of heaven seemed to open, with the moon clearer than ever, selling came back to the crypto board.
After the long winter of 2018/2019, hope was already exhausted, and the current setback is finishing with its remains. The overview of the market can help us to withstand the onslaught and not throw in the towel too early.
The crypto market has some technical peculiarities compared to other traded markets – the speed and volatility of crypto in the short-term turn slow in the long term.
The fundamental cause of the current lousy moment is in the structure of the interrelations of the markets. Bitcoin was the genesis of this market and gave it a unique position of refuge, of an anchor. When the crypto ocean is calm, and the fleet rides the waves at full speed, Bitcoin moves slowly, falling behind. When the storms come to the fore, Bitcoin flashes its crown and becomes the reference that everyone is searching.
And that's what is happening to the market. After months in which the Altcoin segment had flown up, Bitcoin had fallen far behind and lost a significant market share. King Bitcoin, the genesis of cryptocurrencies, was at risk of losing its anchor, and that would have ended up sinking the entire fleet.
The graphic representation of the current situation is in the dominance graphs. The BTC Dominance chart shows an upward break (a tendency for Bitcoin to increase its market share), which occurs because money is flying into Bitcoin from the Altcoin segment.
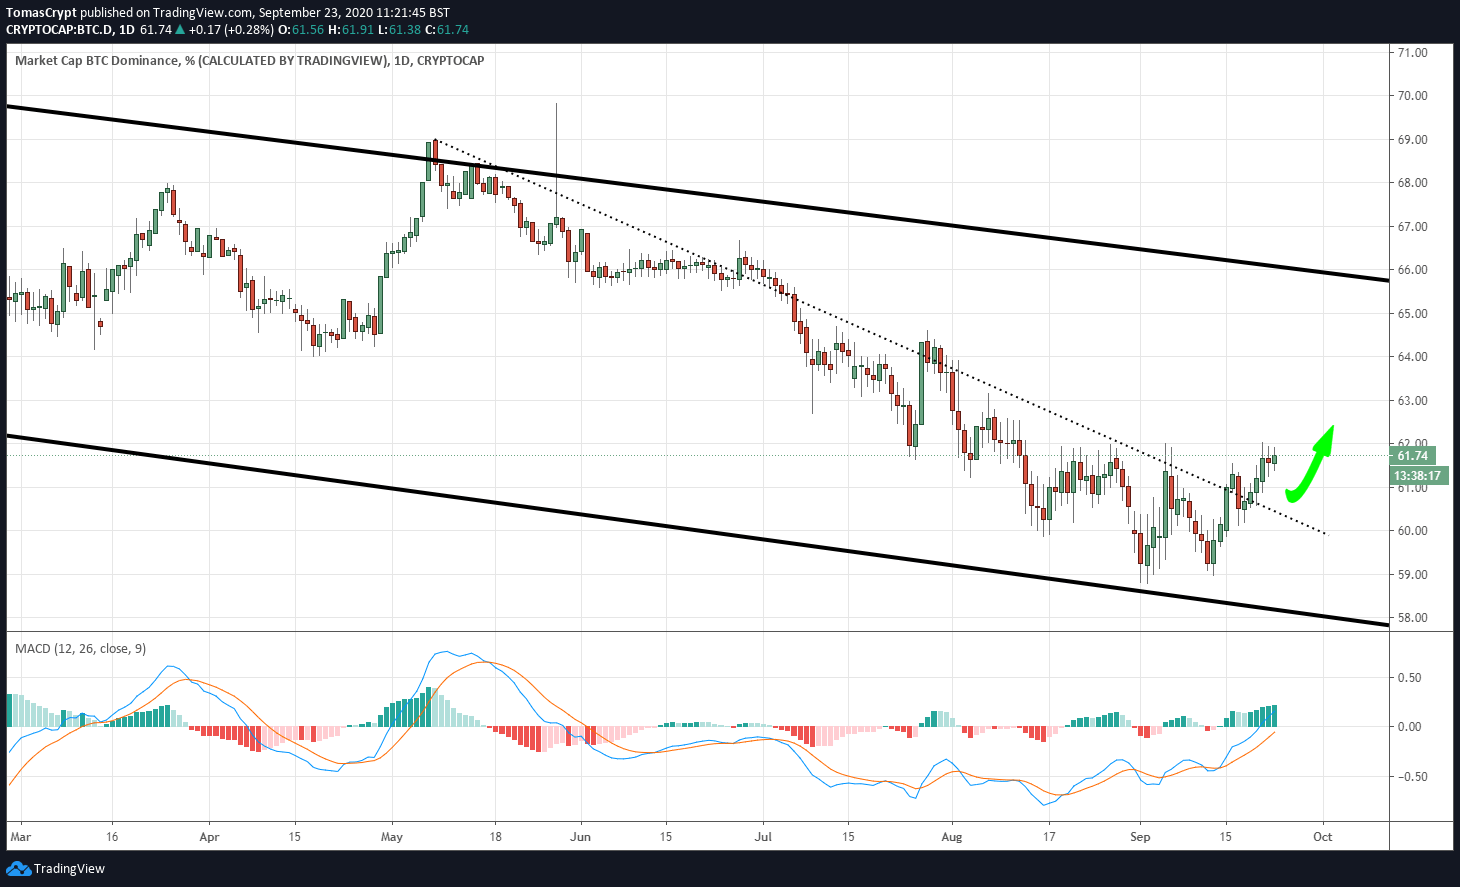
The process isn't definitive, nor is it a long-term change, but in lower-time ranges, it has the consequences we see in the price tables.
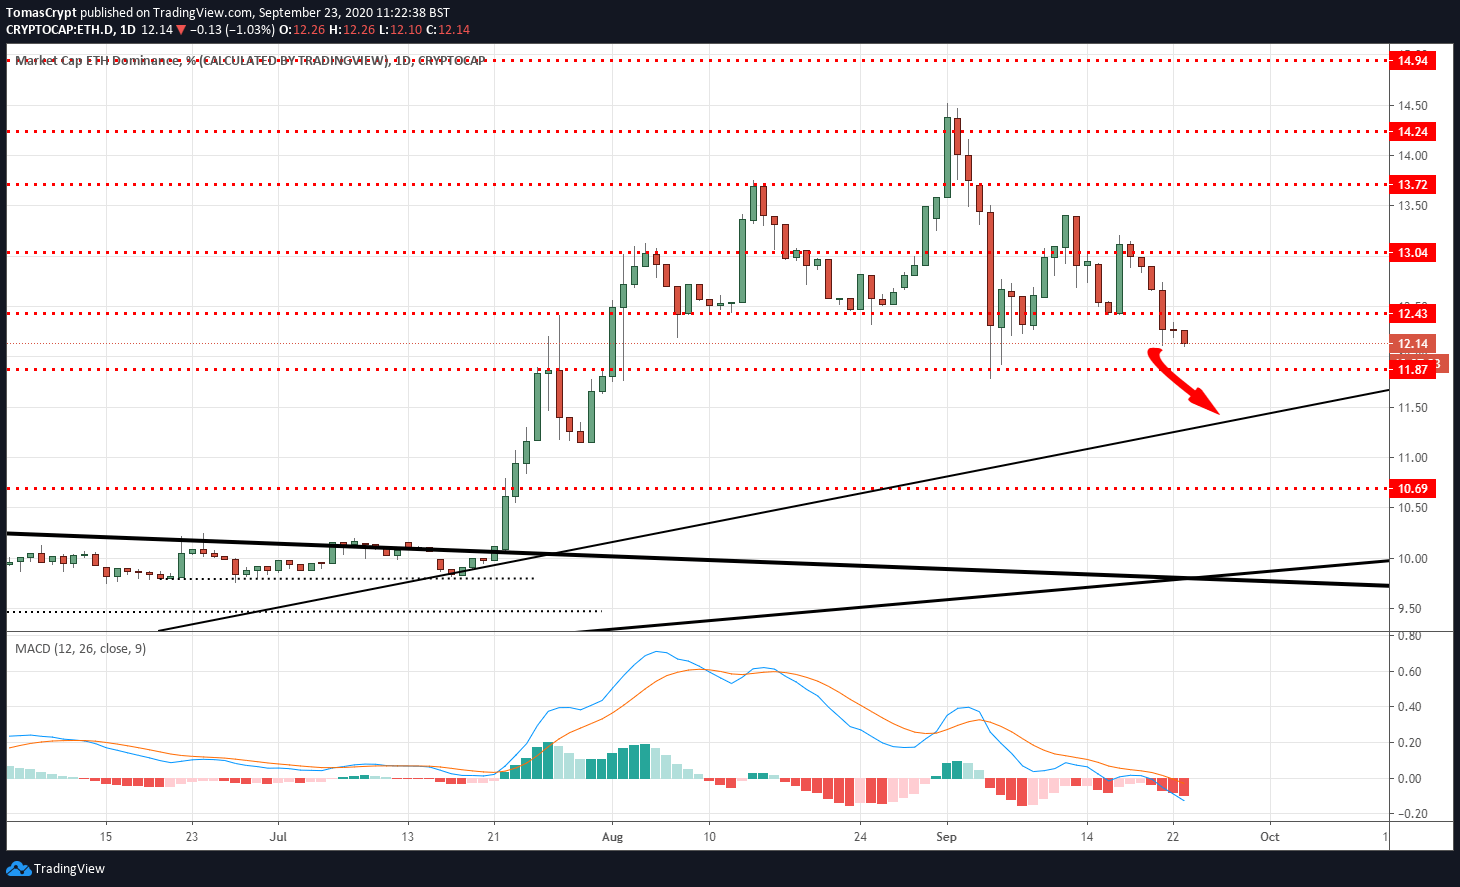
The Ethereum dominance chart shows the drilling of crucial supports and the opening of a trend in which Ethereum would continue to lose value against Bitcoin. And with Ethereum, the rest of the traditional Altcoin segment. The exception is the DeFi, a micro-segment immersed in a bubble whose consequences are indeed behind the flight to quality in the typical crypto board.
ETH/BTC daily chart
The ETH/BTC pair is currently trading at the price level of 0.0322 and puts the price congestion support at 0.0326. The weakness of Ethereum continues and could extend into the next few weeks.
Above the current price, the first resistance level is at 0.0326, then the second at 0.035 and the third one at 0.036.
Below the current price, the first support level is at 0.0308, then the second at 0.0295 and the third one at 0.0278.
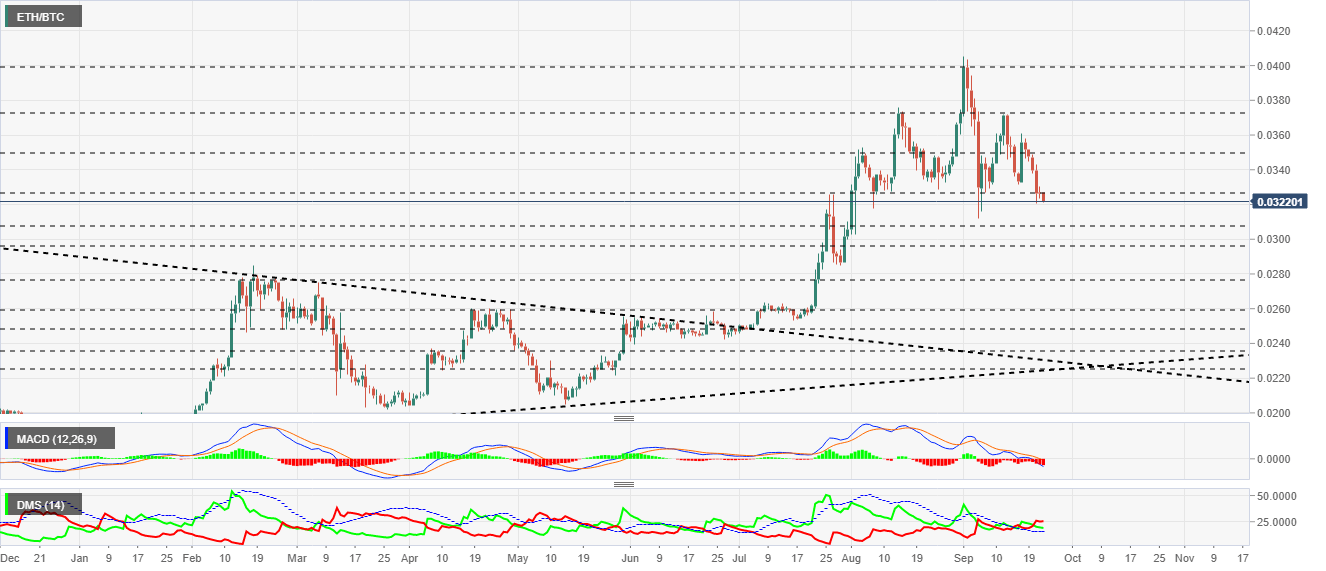
The MACD on the daily chart is deepening on the bearish side of the indicator, and there is no sign at the moment of wanting to change direction. The separation between the exponential moving averages and their slope suggests a downward movement in the short term.
The DMI on the daily chart shows the bears leading the pair, although there is enough distance from the bulls to guarantee the position. The bulls are moving above the ADX line, which would allow them to move up quickly if the market suddenly turns upward.
BTC/USD daily chart
The BTC/USD pair is currently trading at the price level of $10448 and is holding at the low end of the price congestion support at $10440. A bearish breakout of the current support would put the search for the SMA200 at $9350.
Above the current price, the first resistance level is at $11070, then the second at $11350 and the third one at $11930.
Below the current price, the first support level is at $10430, then the second at $9482 and the third one at $9220.
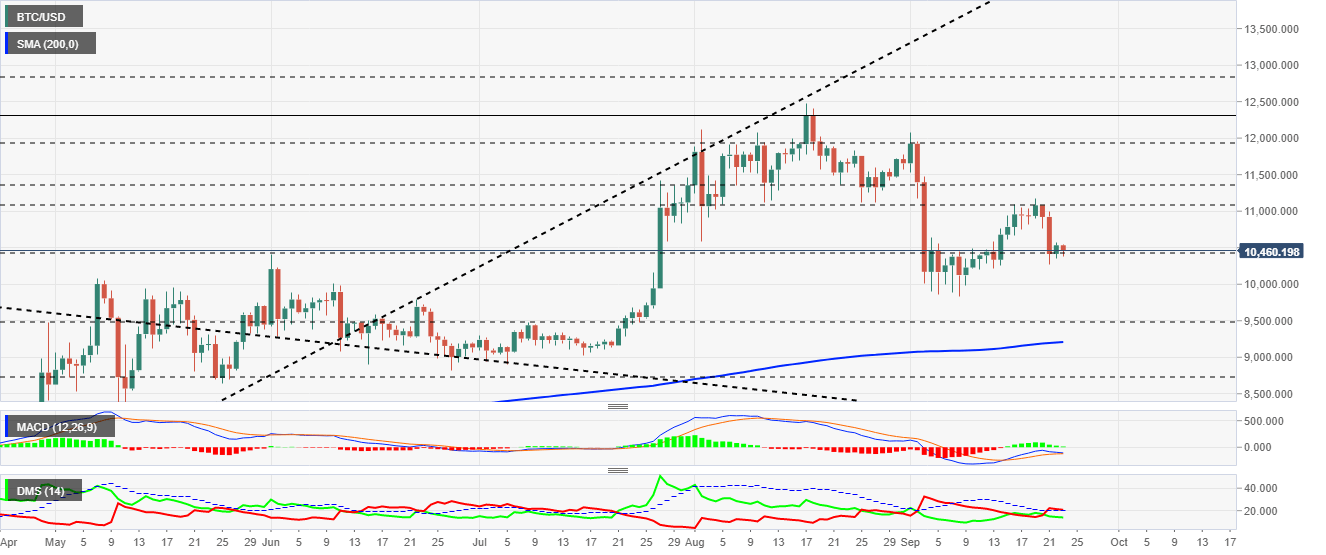
The MACD on the daily chart shows a position where short-term development is uncertain. From the current place, the fast-moving average can bounce upwards although it would meet the resistance of the zero level immediately.
The DMI on the daily chart shows bulls controlling the pair and moving above the ADX line. Bears are moving downward and confirm a bearish scenario in short to medium term.
ETH/USD daily chart
The ETH/USD pair is currently trading at the $335 price level and it is piercing the price congestion support at $345.
Above the current price, the first resistance level is at $340, then the second at $365 and the third one at $375.
Below the current price, the first support level is at $317, then the second at $290 and the third one at $270.
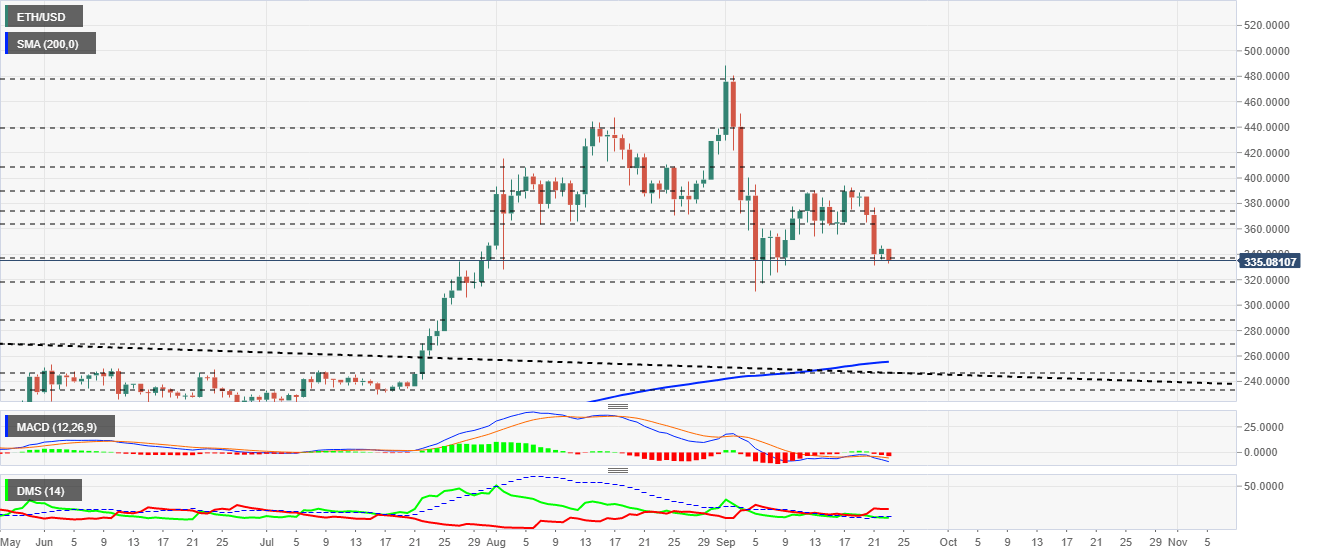
The MACD on the daily chart is opening lower and has a profile that could very well indicate a further acceleration of the downward movement.
The DMI on the daily chart shows bears taking advantage of the bullish trend. The buy-side is positioned below the ADX line and confirms the dominance of the sell-side.
XRP/USD daily chart
The XRP/USD pair is currently trading at the price level of $0.2323 and remains above the current ascending trendline. The loss of this support would signal the end of the trend and a possible test of the $0.20 level.
Above the current price, the first resistance level is at $0.235, then the second at $0.262 and the third one at $0.285.
Below the current price, the first support level is at $0.231, then the second at $0.214 and the third one at $0.205.
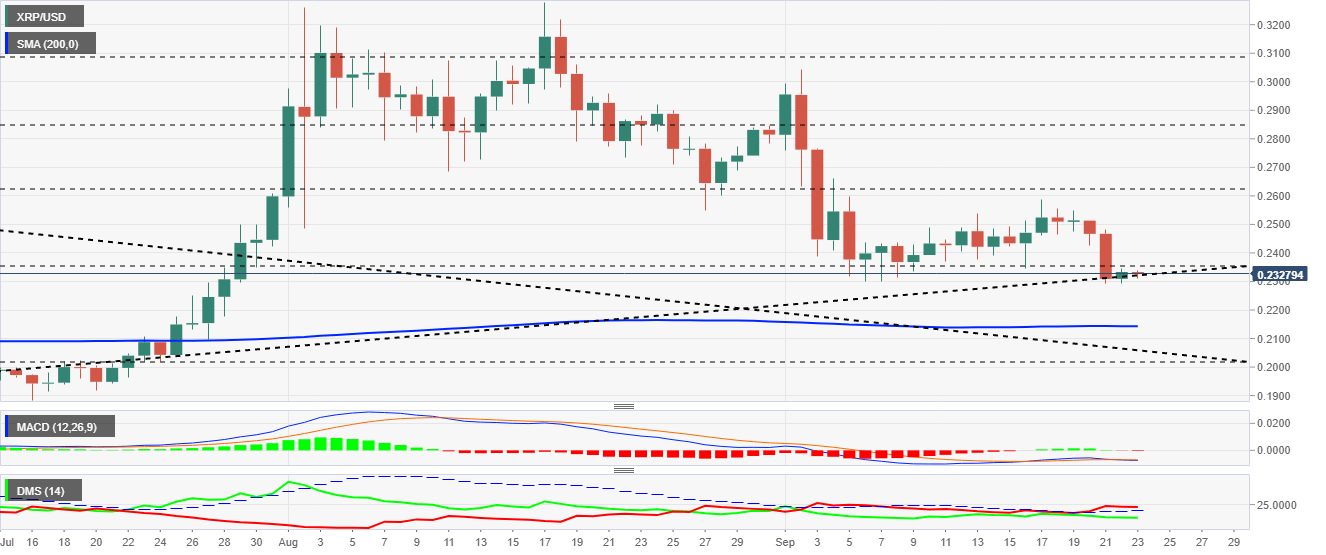
The MACD on the daily chart shows a very flat profile with no strength. The short-term scenario may involve a sudden increase in volatility to break the current impasse.
The DMI on the daily chart shows bears controlling the pair but without a large lead over the bulls. The buy-side is positioned below the ADX line and confirms the current downward trend.
Author

Tomas Salles
FXStreet
Tomàs Sallés was born in Barcelona in 1972, he is a certified technical analyst after having completing specialized courses in Spain and Switzerland. He expanded his technical training following the guidance of great experts on the financial markets.