Top 3 Price Prediction Bitcoin, Ethereum, Ripple: How 2021 has unfolded and what is next for BTC, ETH and XRP
- Bitcoin price locates healthy support at the 12-month simple moving average (SMA) before resuming the current advance.
- Ethereum price respects 61.8% Fibonacci retracement for three consecutive months before launching the new cyclical bull market.
- XRP price fails to capture support at the neckline of an inverse head-and-shoulders pattern but eventually strikes a low at the 78.6% retracement.

Bitcoin price, Ethereum and XRP have engaged various strategic support and resistance levels since the March 2020 low. Each carving out a unique price structure that projects bullish outcomes for the major cryptocurrencies in the months ahead.
Bitcoin price holds secular advance in a period of turbulence
Bitcoin price climbed over 900% from the March 2020 close until the April high, featuring only three negative months, June 2020 and September 2020. In April, the advance concluded with a Doji candlestick pattern on the monthly chart after BTC briefly surpassed the 361.8% Fibonacci extension of the 2017-2020 correction.
The doji candlestick marked a point of exhaustion and indecision as Bitcoin price tested a tactically important resistance level in the 361.8% extension. The result was the largest monthly decline since November 2018, highlighted by a crash on May 19.
The May low nearly struck the 12-month SMA until it rebounded, but Bitcoin price did activate the support of the moving average in June and July. Moreover, BTC tested the ascending trend line from March 2020 low and the 61.8% retracement of the 2020-2021 advance. The result was an 18% gain in July that has followed through into August while still respecting the guidance of the ascending trend line.
As long as the tend line and 12-month SMA are not broken on a monthly closing basis, the secular advance from the March 2020 low will remain live, sending Bitcoin price above the 361.8% extension and the all-time high of $64,899.
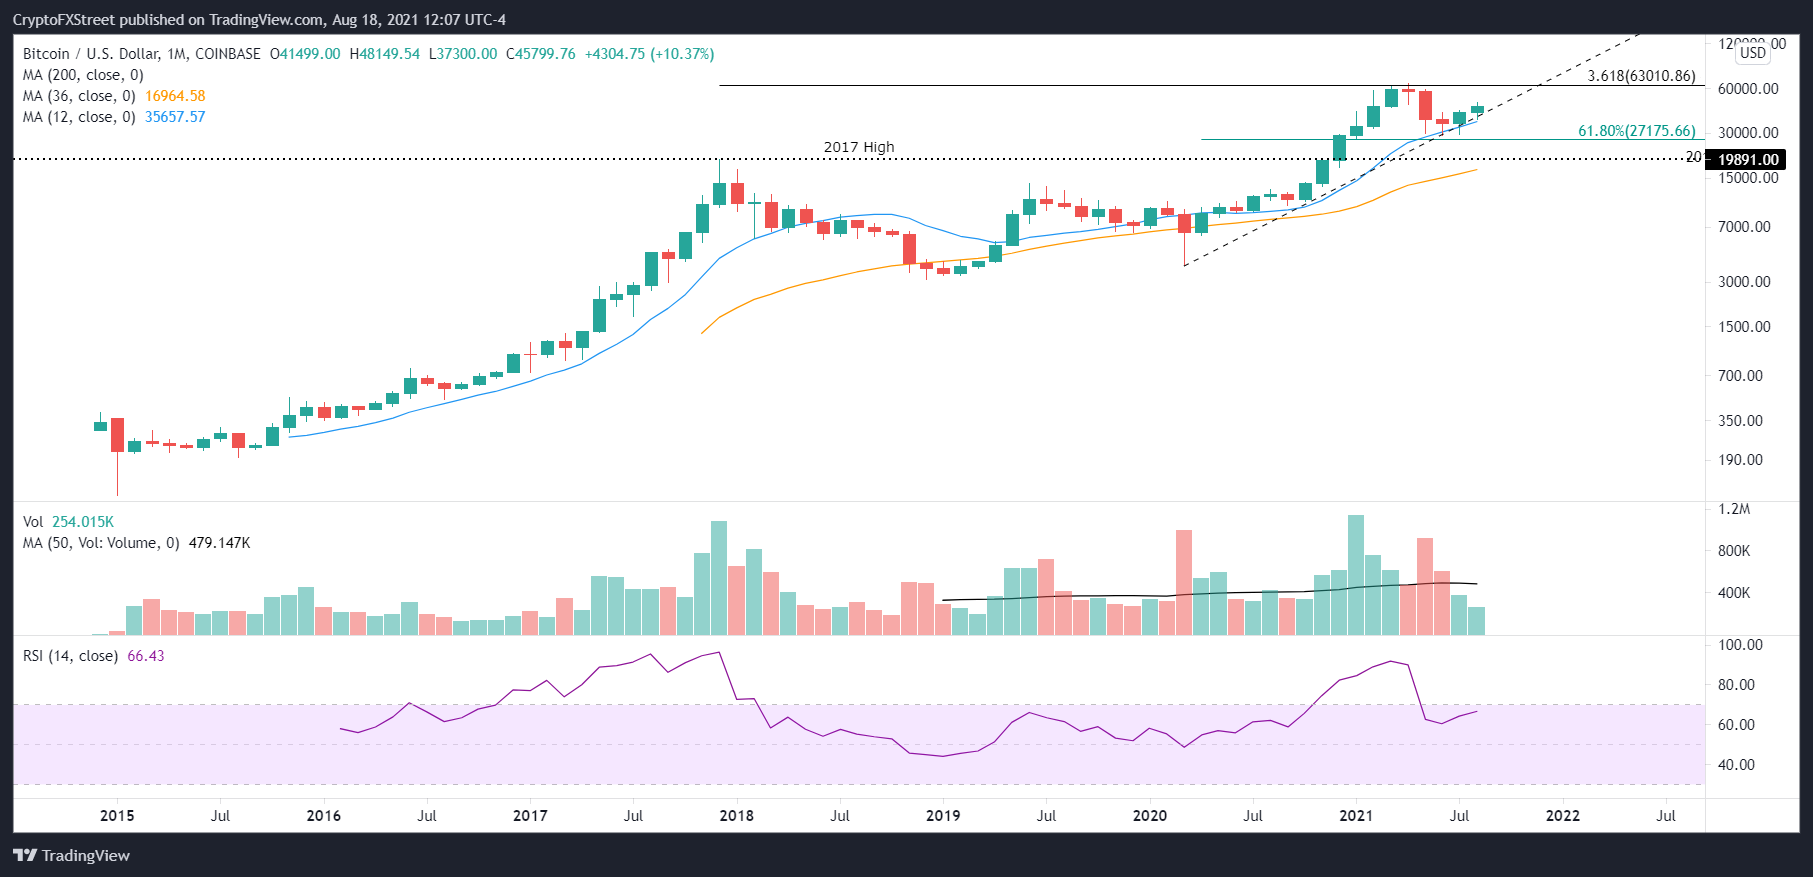
BTC/USD monthly chart
A failure to hold the 2020 ascending trend line and the 12-month SMA on a monthly closing basis will shift the BTC focus on the support granted by the 61.8% retracement at $27,715 and then the 2017 high of $19,891.
Here, FXStreet's analysts evaluate where BTC could be heading next as it looks primed to retrace.
Ethereum prints an ominous pattern
Ethereum price climbed over 3,100% from the March 2020 close to the May 2021 high, logging just three negative months, including a long-legged doji candlestick on the monthly chart. Before closing with a doji candlestick, ETH busted the resistance of the 261.8% Fibonacci extension of the 2018 correction at $3,587 and came within 10% of the 361.8% extension at $4,926.
A long-legged doji candlestick pattern often signals a high for an advance as indecision and uncertainty curtail upside momentum. The pattern carries more importance after an extended advance and on a longer timeframe, such as the monthly chart. In this case, the bearish transition was confirmed by the highest volume for a negative month since 2016.
Ethereum price tested the 61.8% retracement at $1,730 in May. It successfully retested the critical Fibonacci level in June and July before catapulting higher in late July and into August, keeping the secular advance in force. ETH never touched the 12-month SMA or 2020 ascending trend line during the correction.
By respecting various support levels, Ethereum price has positioned the smart contracts token for higher ETH prices, including a new all-time high.
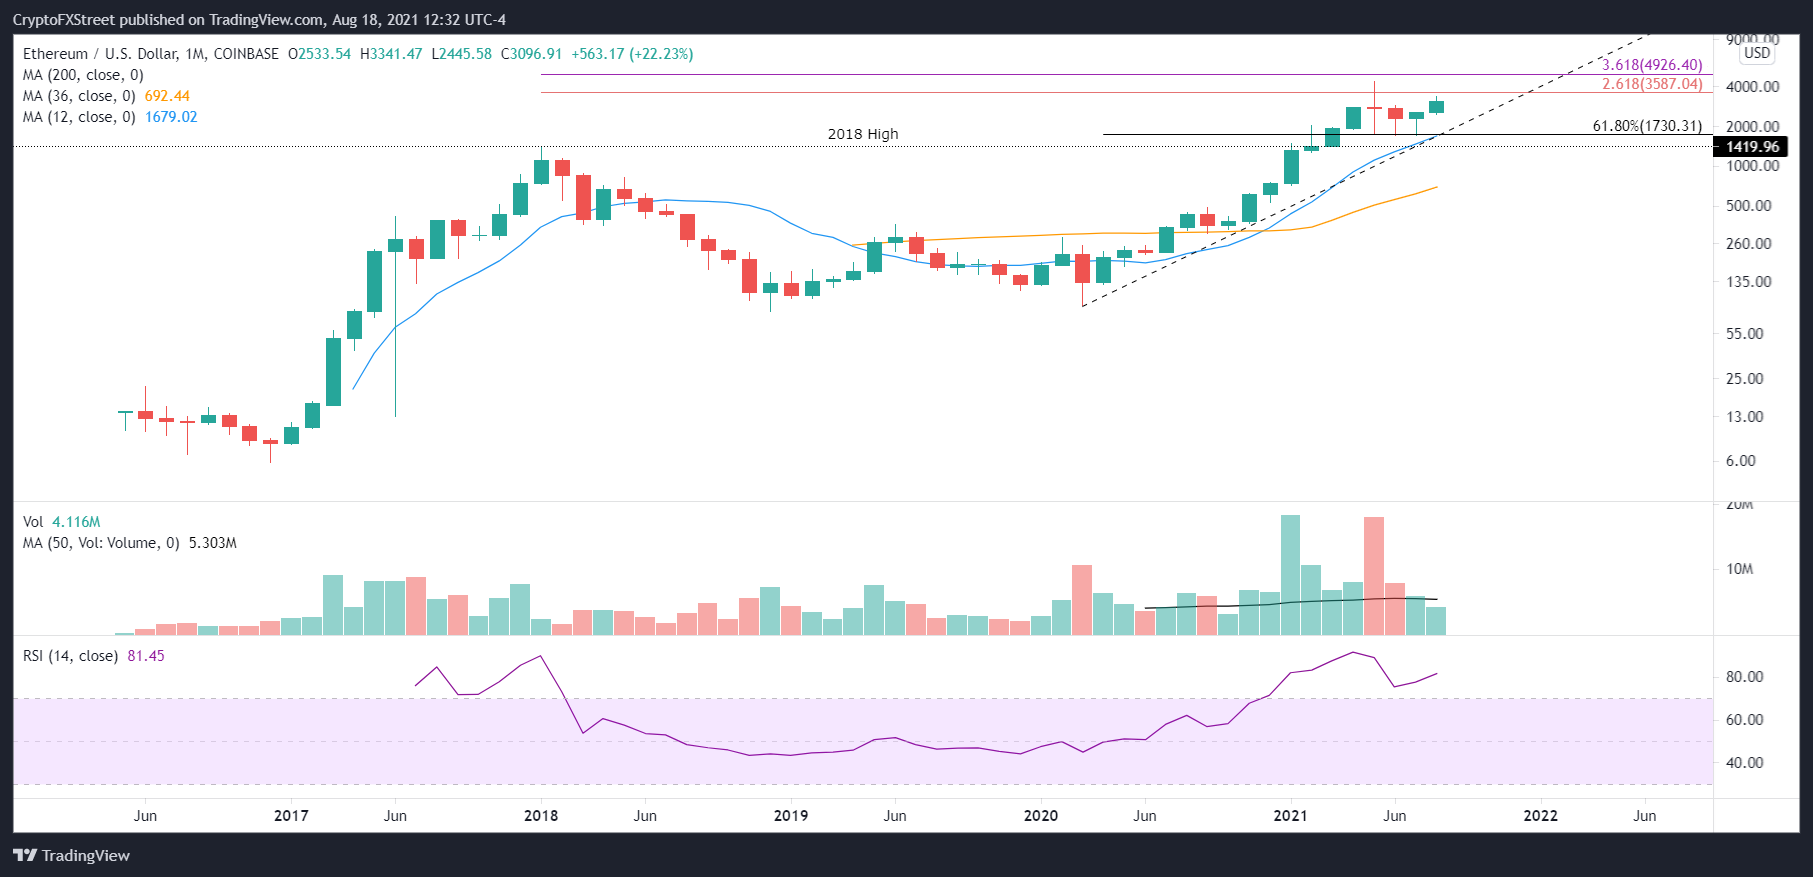
ETH/USD monthly chart
For the bullish narrative to be voided, Ethereum price would need to defeat the confluence of the ascending trend line with the 61.8% retracement at $1,730 and the 12-month SMA at $1,678 on a monthly closing basis. Also, note the 2018 high of $1,419 would be reliable ETH support.
Here, FXStreet's analysts evaluate where ETH could be heading next as it tests crucial resistance level.
XRP price shakes off SEC with a massive breakout
The journey for XRP price has been challenging, including the announcement of an SEC case in late 2020 that drove Ripple down 67% in December, scoring the largest monthly decline since 2017.
XRP price reacted strongly in January with a 125.88% spike higher, taking the international settlements token back above the rising 12-month SMA while shaping the right shoulder of an inverse head-and-shoulders pattern that began in 2018.
Ripple decisively broke the neckline of the inverse head-and-shoulders pattern in April with a 180.34% gain and eclipsed the pattern’s measured move XRP price target of $1.45 (86%) before stalling at the 50% retracement of the 2018-2020 correction at $1.70.
The resistance at the 50% retracement was definitive, resulting in consecutive months of -30%+ losses, a close below the neckline at $0.76, a break of the 12-month SMA and a test of the 78.60% retracement of the 2020-2021 advance at $0.50. However, XRP price never registered a monthly close below the moving average and closed July with an inside month on the bar charts.
Suppose the XRP price closes August above the neckline at $.76. In that case, the cross-border remittances token will be well-placed to bust the resistance at the 50% retracement and other Fibonacci levels on the path to the all-time high at $3.30, printed in January 2018.
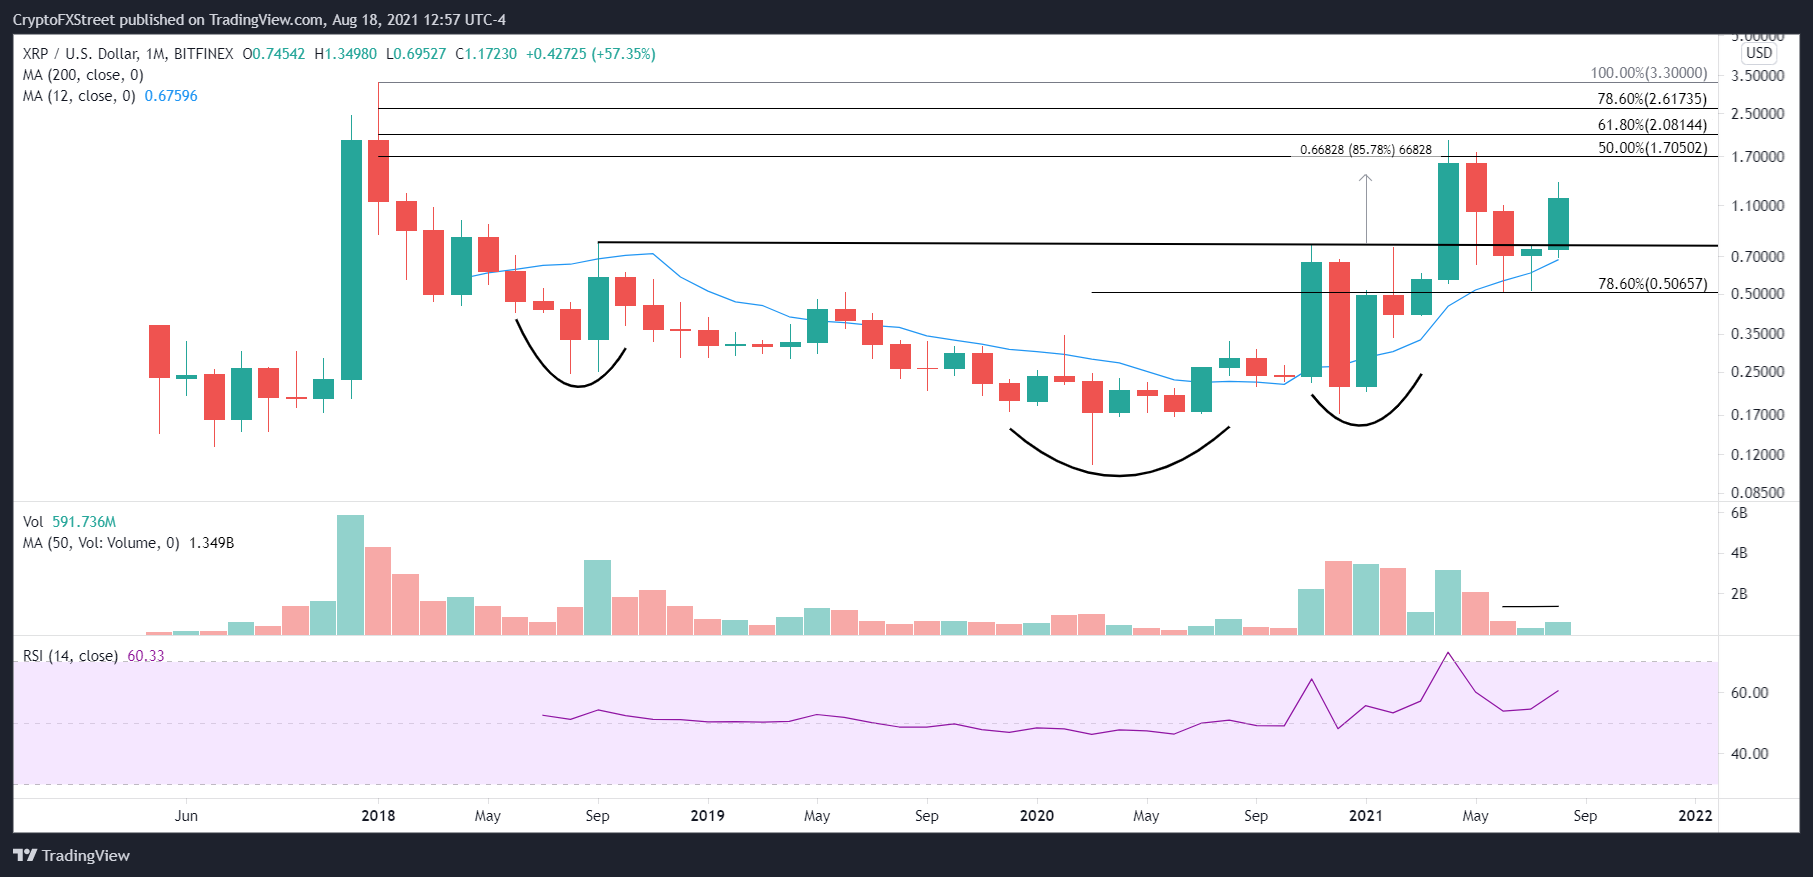
XRP/USD monthly chart
An XRP price close below the neckline and the 12-month SMA at $0.67 would confirm the April high at $1.96 as the end of the advance, forcing a long-term bearish narrative for Ripple.
There is a tendency for market operators to be fixated on the day-to-day volatility, not considering the bigger picture. As the monthly charts demonstrate above, there is a rhythm to the price action based on the long-term resistance and support levels and the chart patterns and Fibonacci levels.
Here, FXStreet's analysts evaluate where Ripple could be heading next as it seems primed for a pullback before higher highs.
Author

Sheldon McIntyre, CMT
Independent Analyst
Sheldon has 24 years of investment experience holding various positions in companies based in the United States and Chile. His core competencies include BRIC and G-10 equity markets, swing and position trading and technical analysis.


