Top 3 Price Prediction Bitcoin, Ethereum, Ripple: Crypto markets weigh new leg-up or deep correction
- Bitcoin price takes a slow approach as it hovers above a demand zone ranging from $43,150 to $45,791.
- Ethereum price is struggling to pierce the supply barrier extending from $3,201 to $3,559.
- Ripple price is looking to retest the $1.09 support level after an explosive climb.

Bitcoin price is hovering above a crucial demand barrier, which could propel it higher, but investors need to watch for a spike in selling pressure that pierces the said support zone, leading to a break below it.
While Ethereum price seems to be having a tough time, Ripple price is retracing after a huge upswing over the past week.
Bitcoin price stuck in limbo
Bitcoin price showed a massive upswing starting on August 5, but things slowed down as its first attempt to shatter the supply zone extending from $43,150 to $45,791 failed. Although BTC eventually pushed through it, it is having a hard time holding above it.
The overall structure of the market looks bullish, so investors can assume the uptrend will continue after the sideways movement. A potential spike in buying pressure that bounces BTC off the demand zone will first encounter the $49,024 and $50,958 resistance barriers.
Reclaiming the $50,000 psychological level is crucial and will not be a walk in the park. Therefore, retesting this barrier could induce FOMO and trigger further gains.
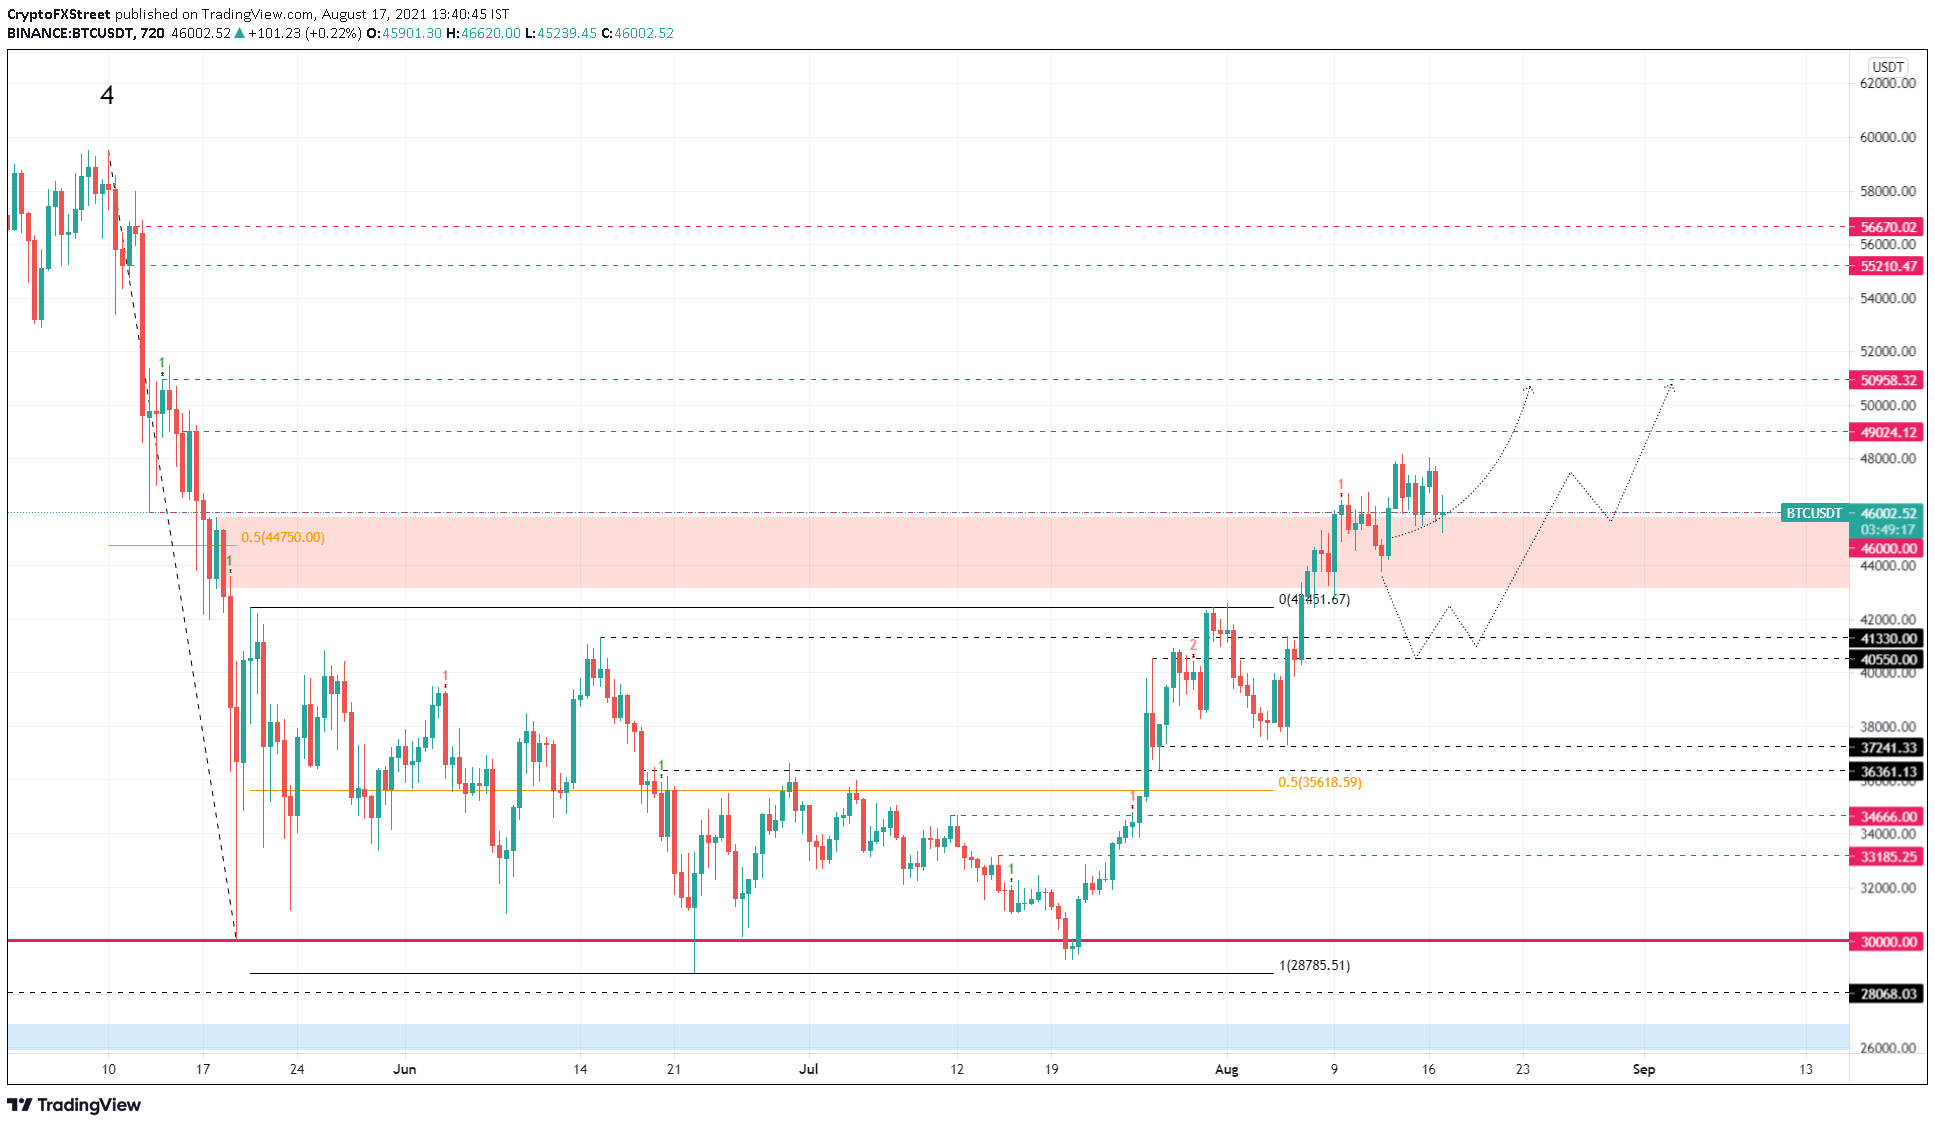
BTC/USDT 12-hour chart
If Bitcoin price reenters the said demand zone, the bullish narrative will start to look weak, pushing investors to book profits. This move could quickly produce a decisive 12-hour candlestick close below $45,791 and invalidate the bullish thesis.
Ethereum price struggles but remains bullish
Ethereum price has been setting up higher highs and higher lows on a 12-hour time frame as it attempts to slice through the supply zone extending from $3,201 to $3,559.
In a worst-case scenario, investors can expect a retest of the $3,000 psychological level followed by an increased buying pressure that restarts the upswing.
If the buying pressure is sufficiently high, it will produce a decisive 12-hour candlestick close above $3,559, confirming a resurgence of buyers and the start of a new leg-up.
$3,756 is the next critical resistance level that will face a retest and, eventually, the $4,071 supply barrier.
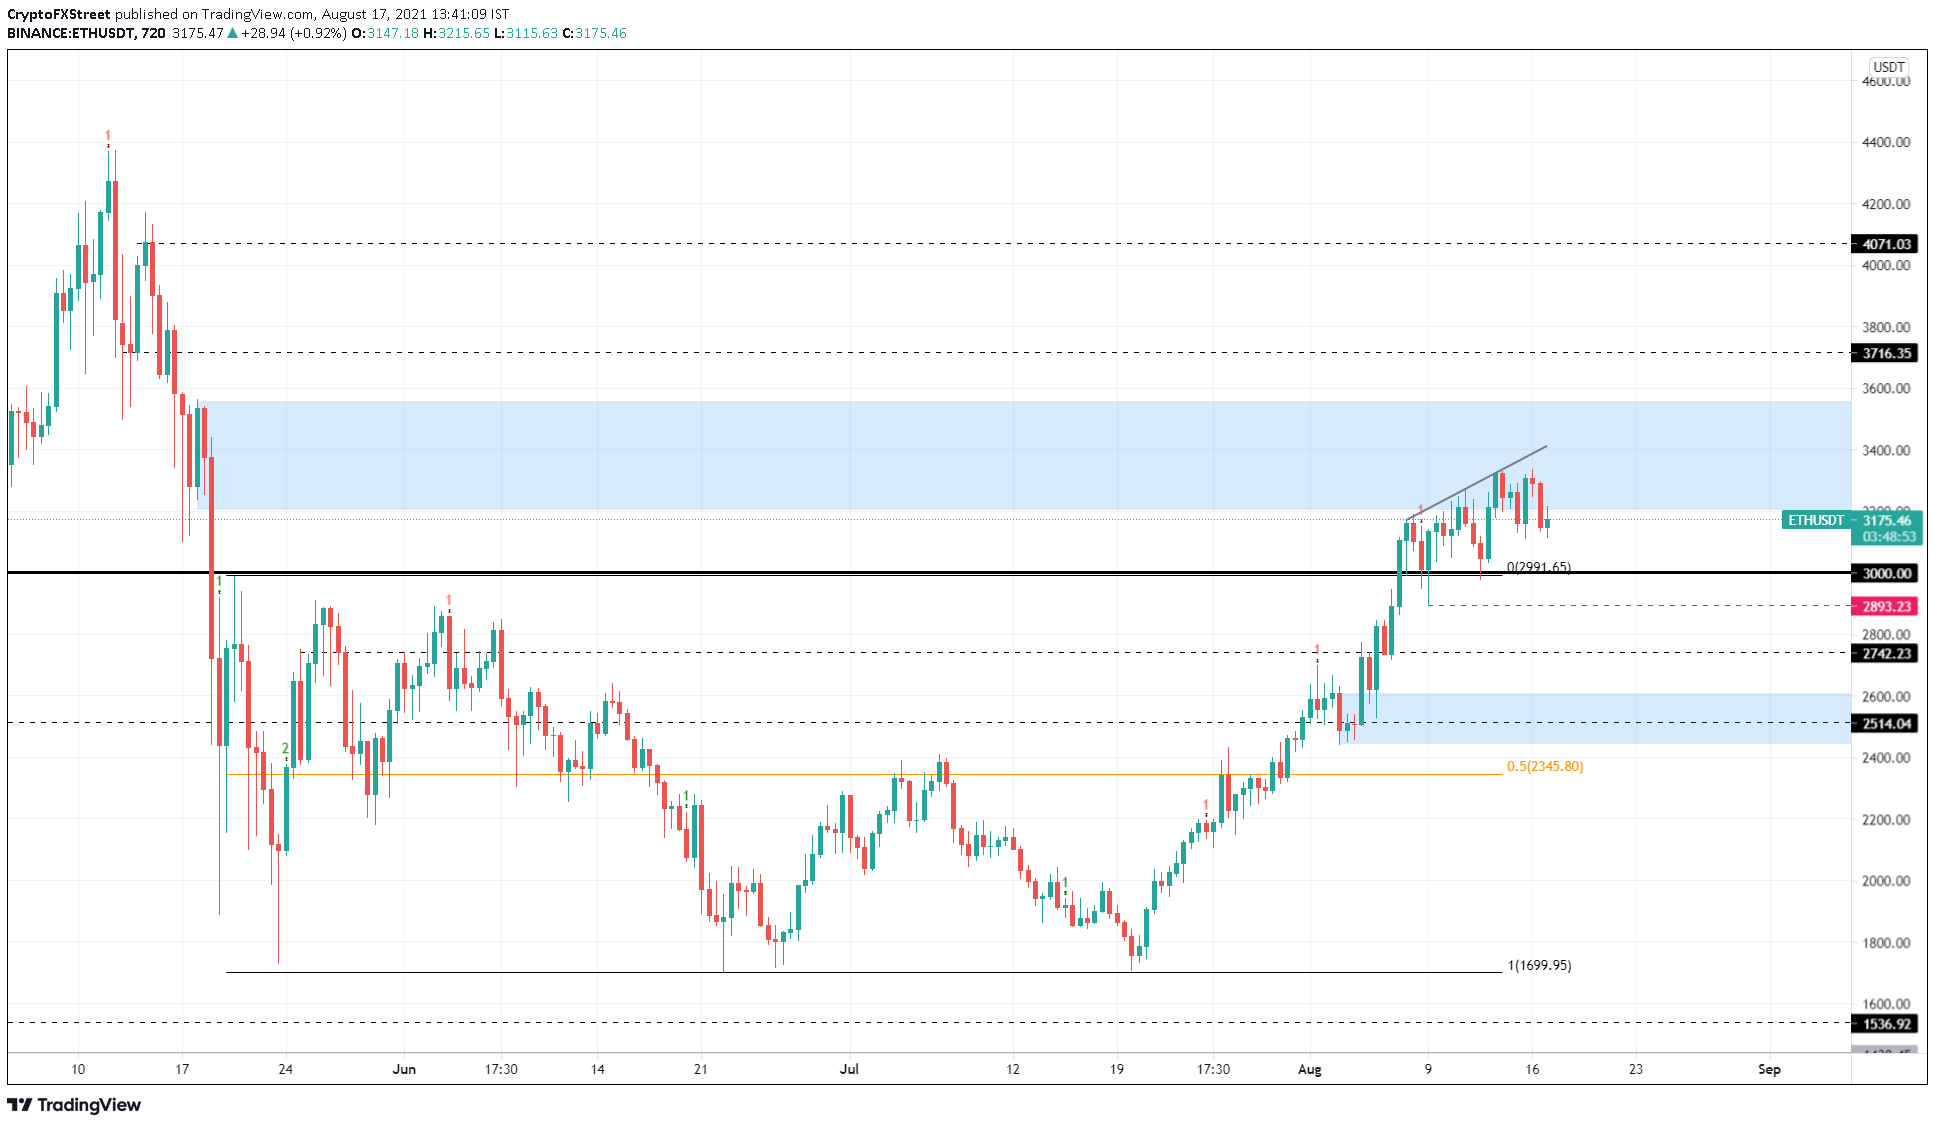
ETH/USDT 12-hour chart
Things will quickly head south if Ethereum price fails to breach the supply zone ranging from $3,201 to $3,559. A rejection around this barrier will result in a downtrend that retests the $3,000 resistance level, a breakdown of which will invalidate the bullish thesis and potentially trigger further losses.
Ripple price gathers steam
Ripple price set up two highers and two lower lows since late November 2020. Connecting these swing points using trend lines results in the formation of an ascending parallel channel.
During its recent run-up, XRP price rallied roughly 77% from August 9 and August 15, pushing it to a swing high at $1.35, coinciding with the middle line of the parallel channel.
This leg-up reached its local top and is currently retracing to the immediate support level at $1.09.
Investors can expect a resurgence of buyers around $1.09 leading to a bounce to the next resistance level at $1.70, roughly 55% away.
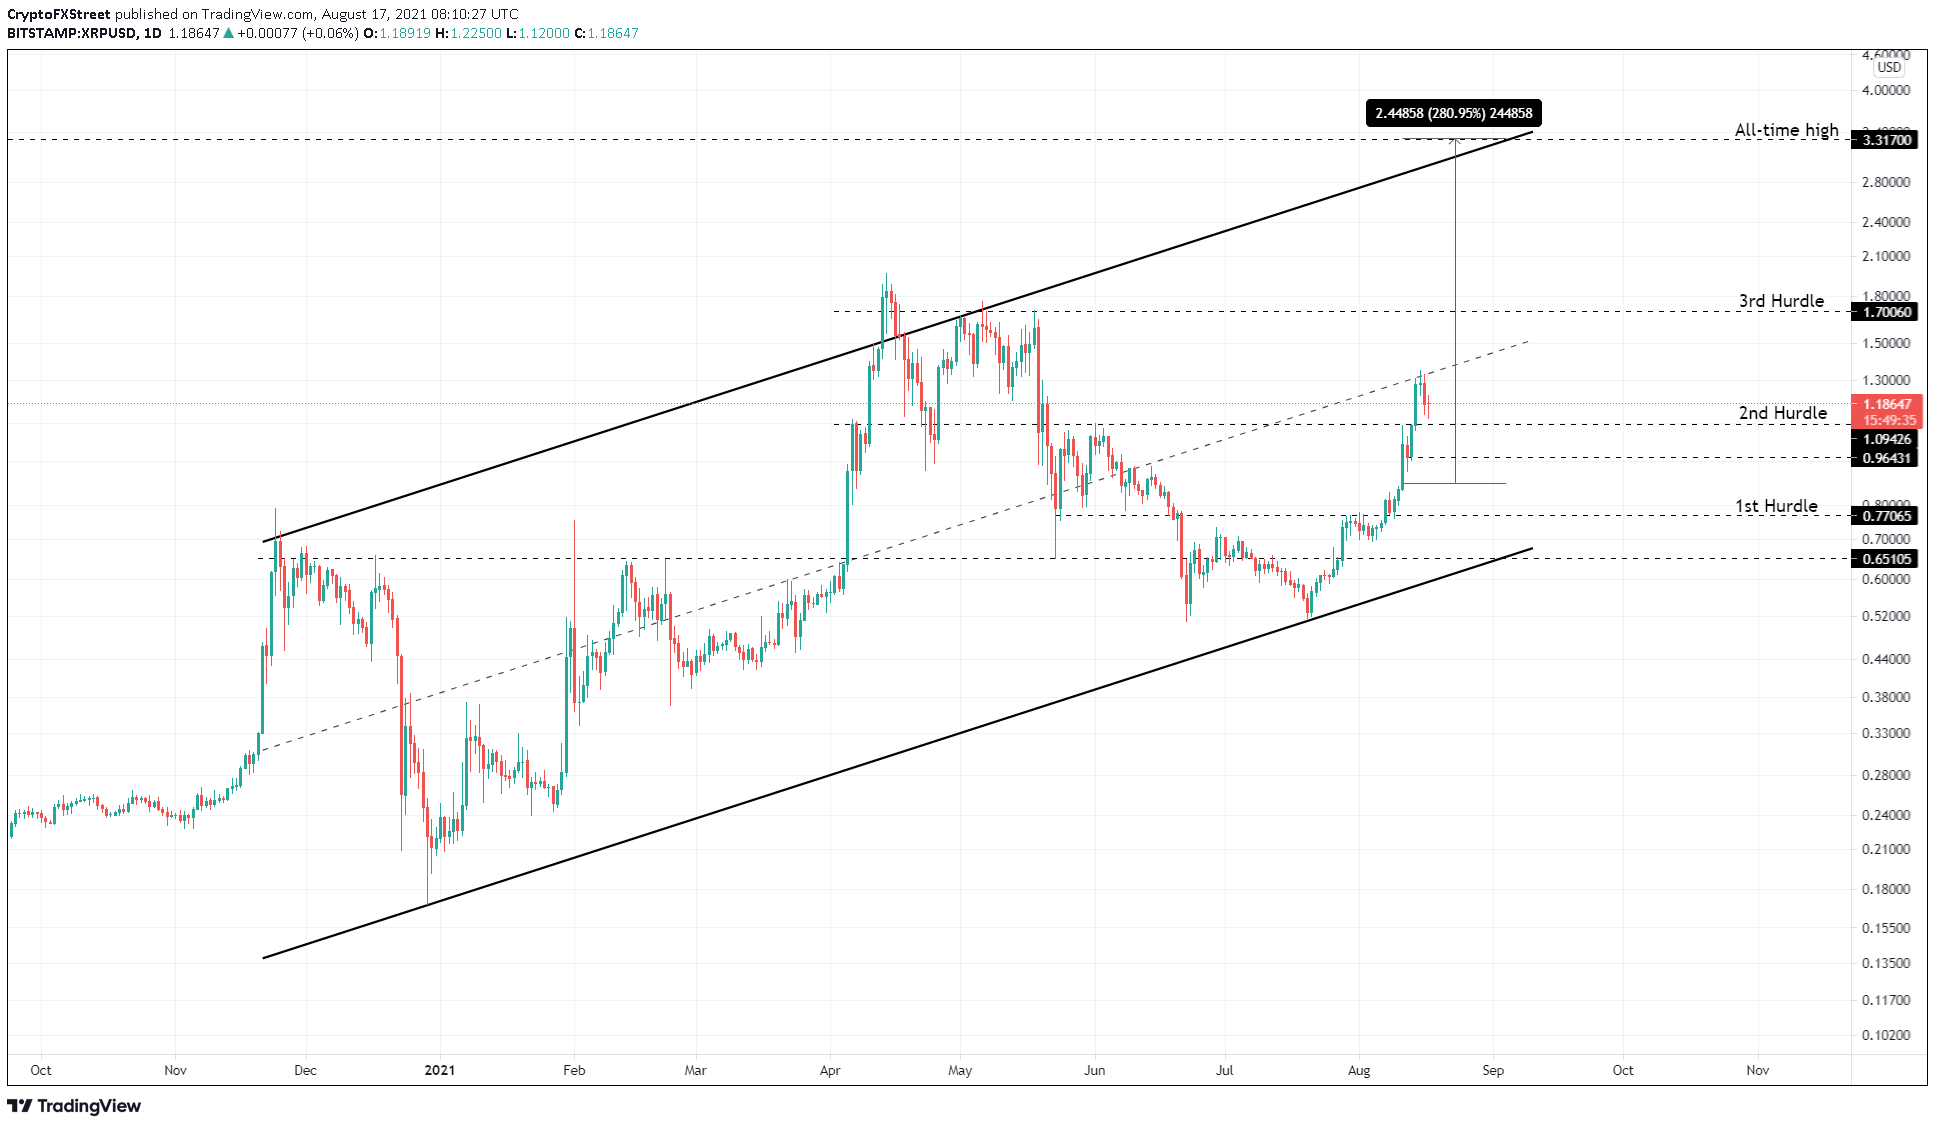
XRP/USDT 12-hour
While a bounce from $1.09 seems plausible, in some cases, XRP price might head to $0.96 before reversing its trend. However, a breach of the $0.96 support level will invalidate the bullish thesis and potentially trigger a sell-off to $0.77.
Author

Akash Girimath
FXStreet
Akash Girimath is a Mechanical Engineer interested in the chaos of the financial markets. Trying to make sense of this convoluted yet fascinating space, he switched his engineering job to become a crypto reporter and analyst.


