Top 3 Price Prediction Bitcoin, Ethereum, Ripple: Forecasting the first moves of 2023
- Bitcoin price settled December with a 4% monthly loss in market value.
- Ethereum price could decline by 50% if bulls lose the support of the $1,100 zone.
- XRP price fell by 10% on January 2, but the bulls quickly rebounded.

The crypto market produced mundane price action to close out 2022, as all three cryptocurrencies evaded the anticipated Santa Rally. 2023 could be due for more downward price action if the lackluster effort from bulls continues.
Bitcoin price ends 2022 on a bearish note
Bitcoin price produced disappointing price action throughout December, as investors anticipated an end-of-year Santa Rally that never occurred. As the final hours of 2022
winded down, the peer-to-peer digital currency remained submerged below the $17,000 barrier. Ultimately, BTC would settle December’s auction with a 4% loss of market value since the start of the month.
Bitcoin price currently auctions at $16,707. Countertrend bulls are still attempting to produce a crypto 180. In order to do so, November’s settling price at $17,163 will be a necessary zone to conquer and flip as support. The earliest evidence of the uptrend rally underway would be a breach of the 21-day simple moving average at $16,870. The indicator rejected BTC-bulls on two occasions last month, and the third rejection could be the catalyst of a sweep-the-lows event targeting the 2022 low at $15,476.
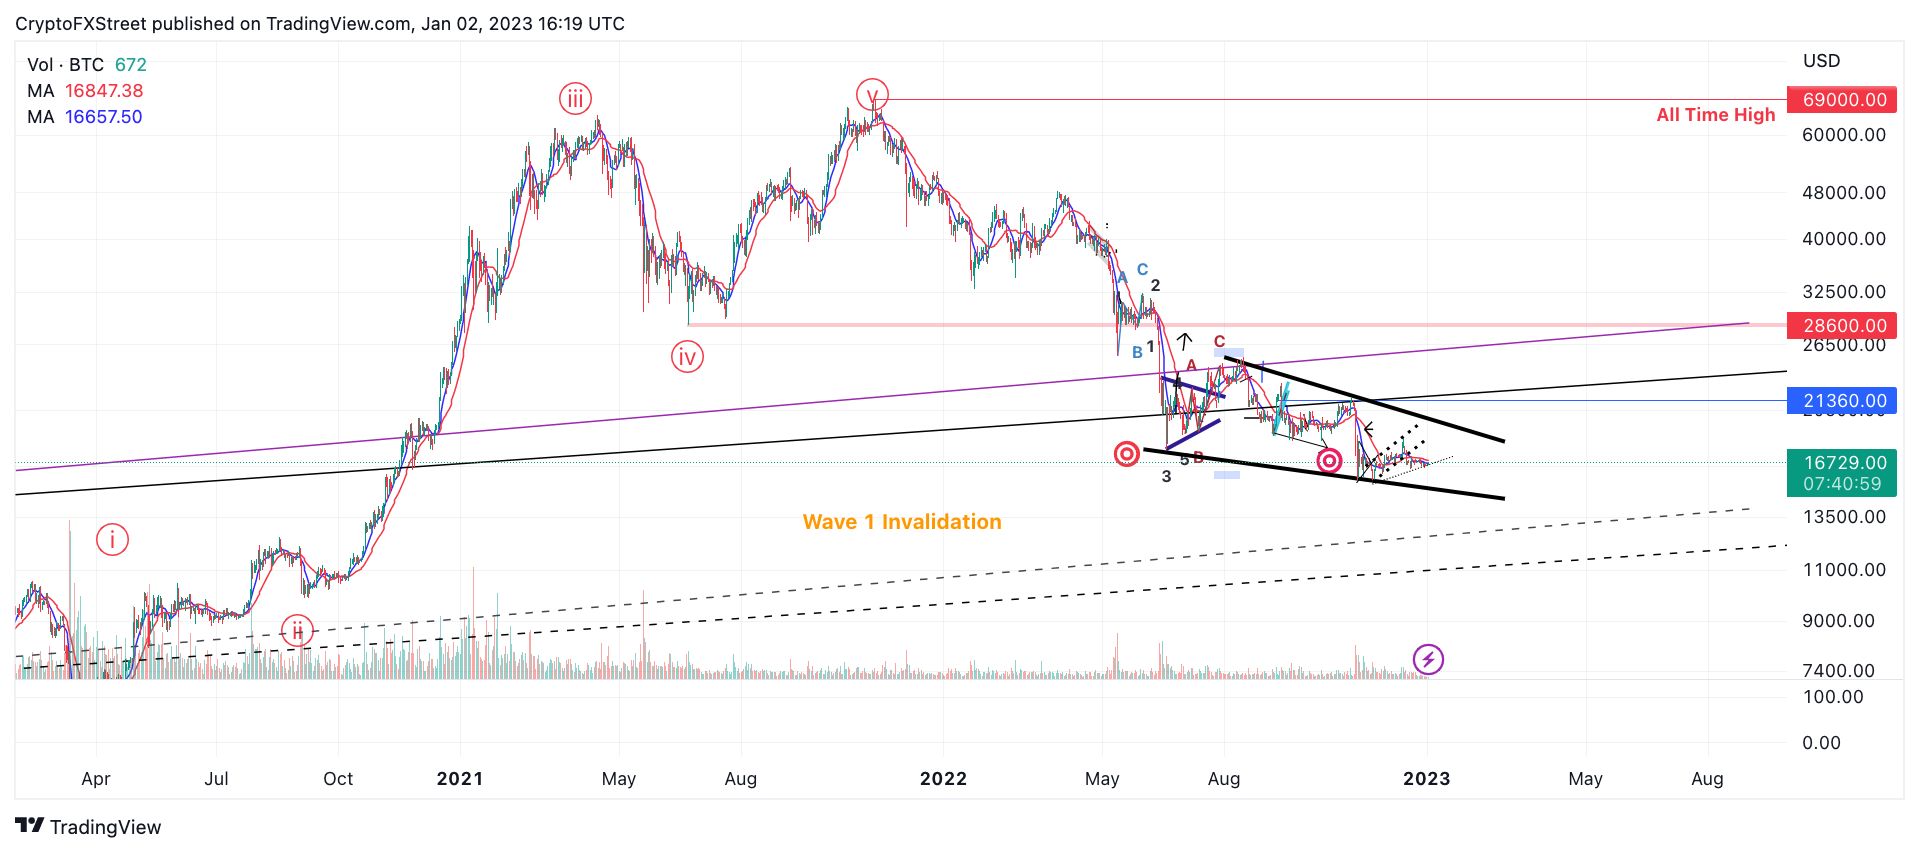
BTC/USDT 1-Day Chart
Ethereum price could decline tremendously
Ethereum price closed out in December with a 3% loss in market value. While the decentralized smart-contract token has been known to diverge from Bitcoin’s price action, Q4 of 2022 witnessed a significant correlation between the two crypto giants.
Ethereum price currently trades at $1,216. After finding support near the $1,100 zone in mid-December, the bulls produced an ascending trendline. The consolidation hovering directly above the supportive barrier suggests trouble for the 2022 low at $880.
A daily closing candlestick beneath the trend line would be problematic. Investors could experience up to a 50% loss targeting the $650 zone. The target zone is a 50% retracement level, extracted from a Fibonacci retracement tool surrounding the 2020-2021 bull run from the $86 low to the $4,850 high.
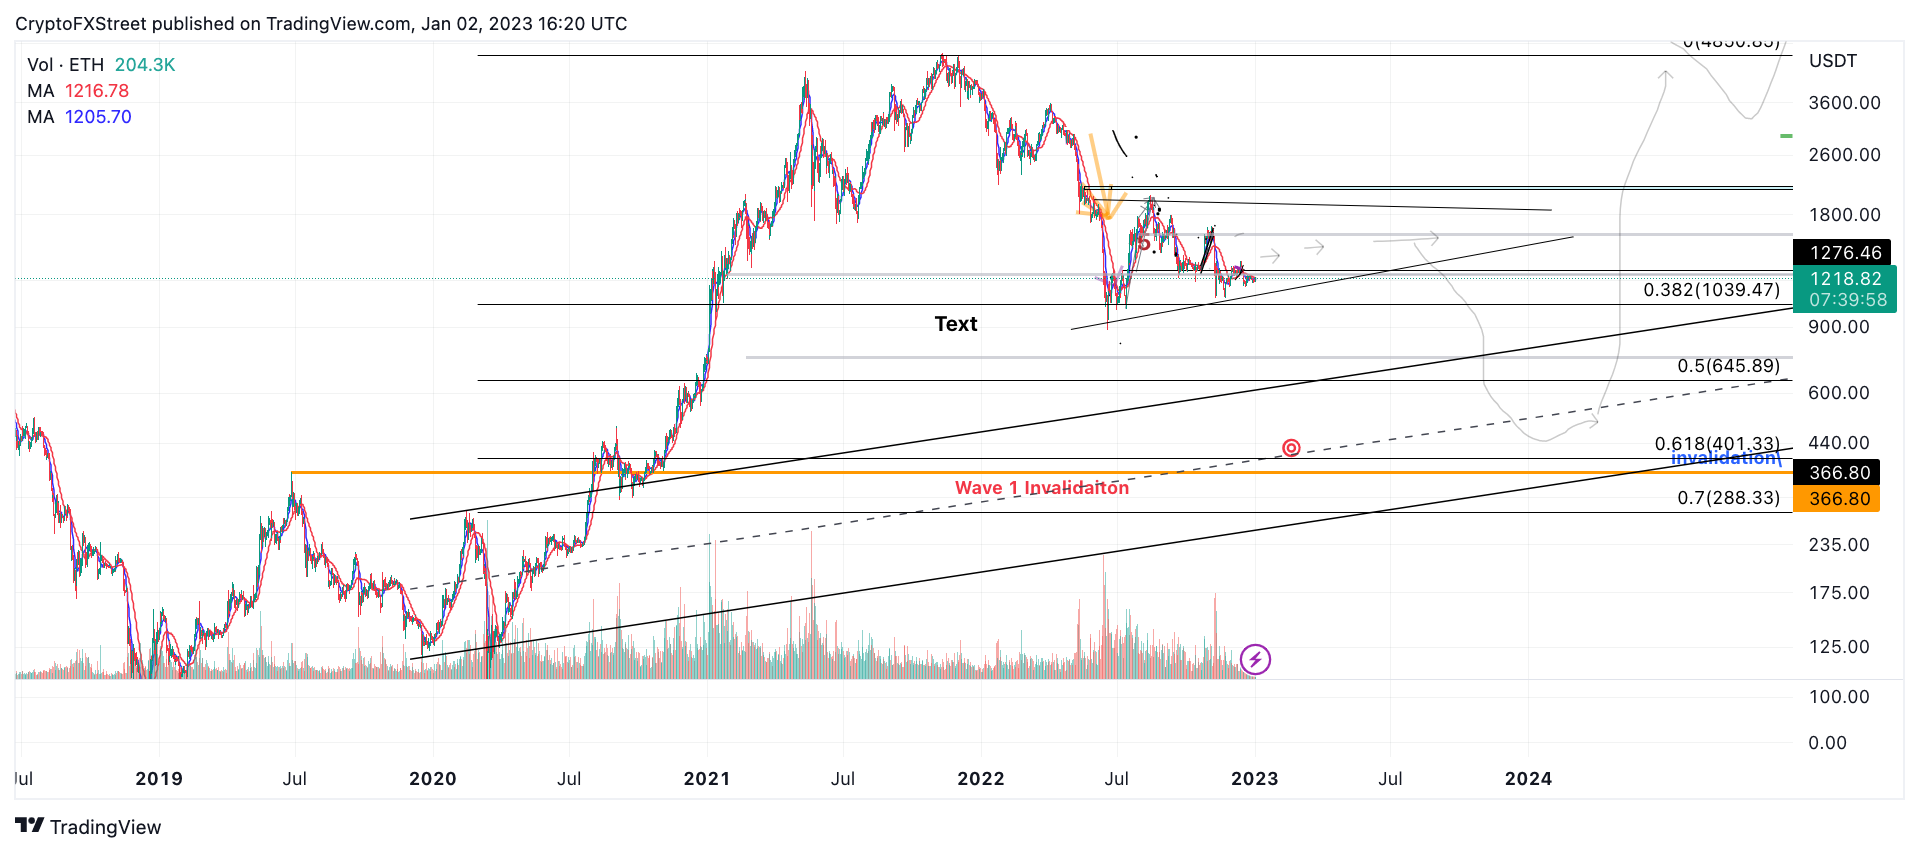
ETH/USDT 1-Day Chart
XRP price shows an early month liquidation
XRP price showed much more bearish severity as the digital remittance token closed out in December with a 16% loss of market value. On January 2, the bears attempted to breach the 2022 low at $0.287 but fell short. XRP fell by 10%, producing a low of $0.30, but the price quickly rebounded into the $0.34 zone.
Ripple price is now auctioning at $0.345. Although the recent liquidation is an enticing bullish gesture, investors should consider remaining sidelined for a few reasons. The 8-day exponential moving average and 21-day simple moving average hover directly above the current trading range.
Additionally, the Volume Indicator shows the recent move as a relatively normal trading day, with only $480 million worth of transactions occurring during the auction. The June 18 low at $0.287 produced nearly twice as many transactions at $866 million and was the catalyst of XRP’s 75% relief rally into the $0.56 level weeks later. At the time of writing, the bulls will need to produce more cues to consider a true market reversal underway.
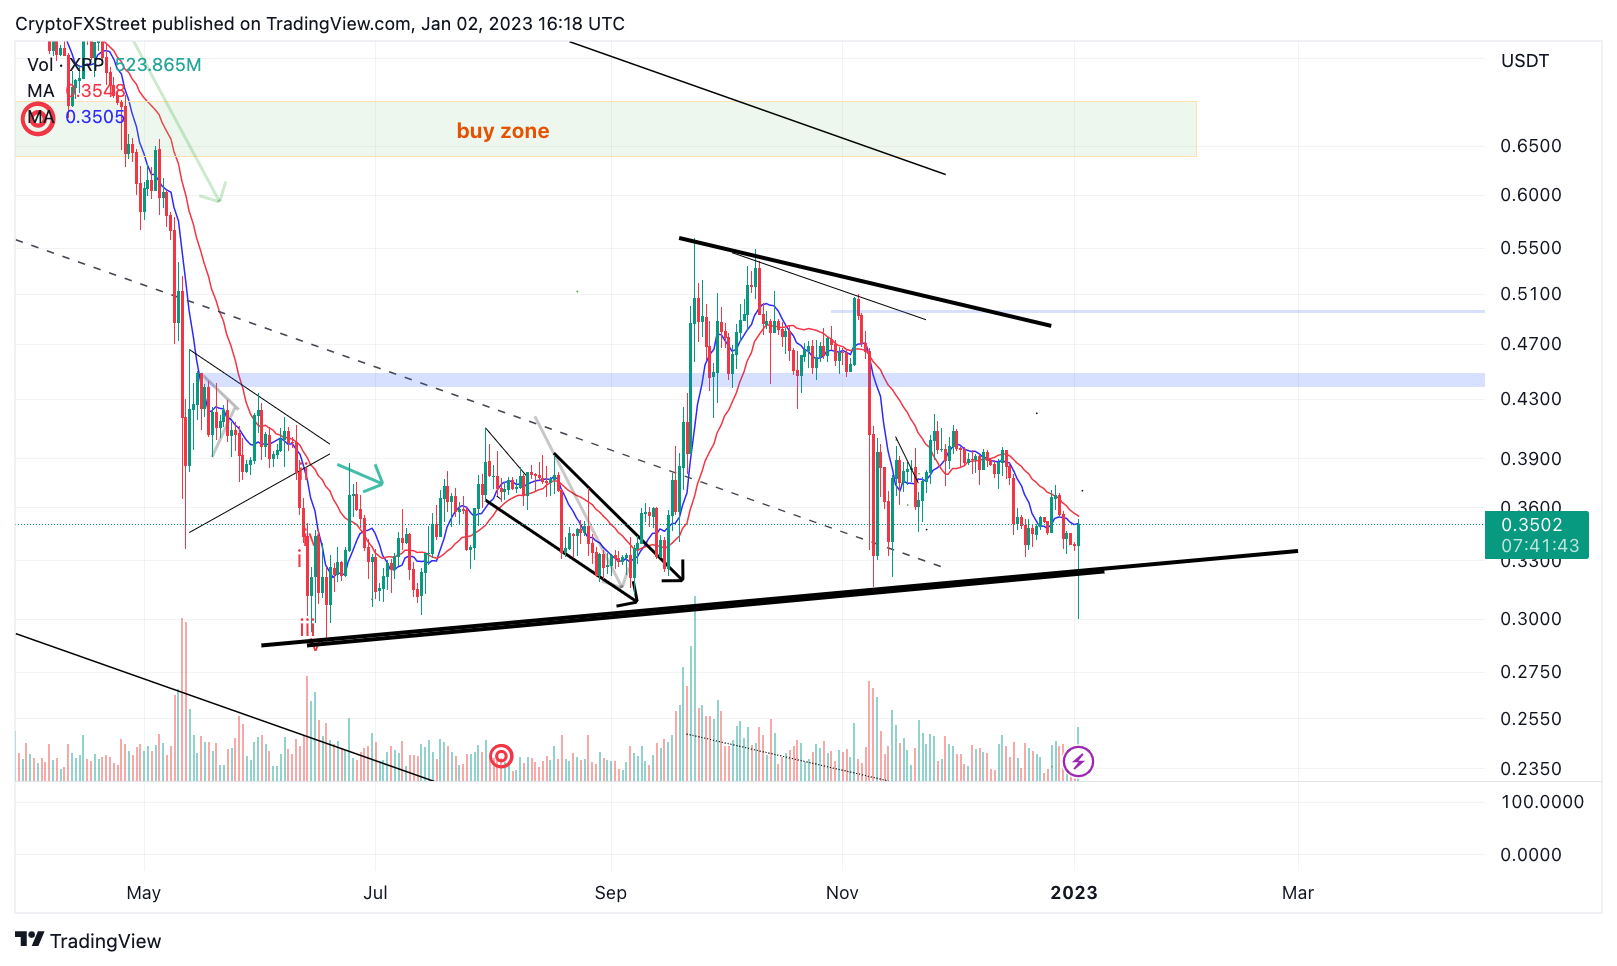
XRP/USDT 1-Day Chart
Author

Tony M.
FXStreet Contributor
Tony Montpeirous began investing in cryptocurrencies in 2017. His trading style incorporates Elliot Wave, Auction Market Theory, Fibonacci and price action as the cornerstone of his technical analysis.


