Top 3 Price Prediction Bitcoin, Ethereum, Ripple: An end of year recap
- Bitcoin price is down 75% since all-time highs.
- Ethereum price has much more space to fall without invalidating the bullish macro thesis
- XRP price could be setting up for a sweep of the yearly lows with a breach below $0.35 as the catalyst

The crypto market consolidates at the lower half of a declining trend. At the current time, most signals are pointing south. The top 3 cryptos will need to pull a total of 360 to restore faith in an end-of-year rally.
Bitcoin price has space to fall
Bitcoin price is down 64% on the year, and 75% since all-time highs at $69,000 were established in November 2021. On December 23, the peer-to-peer digital currency hovers at the bottom half of an extending downtrend. The larger time frame narrative must include significant cues to deem the downtrend over.
Bitcoin price currently auctions at $16,843. A Fibonacci retracement tool surrounding the 2020 low at $3,850 and the all-time high at $69,000 shows BTC hovering just above the unbreached 50% Fib level at $15,017. Thus the Bitcoin price still has a 10% cushion space to fall without invalidating the popular macro Elliot Wave Count proposed earlier in the year.
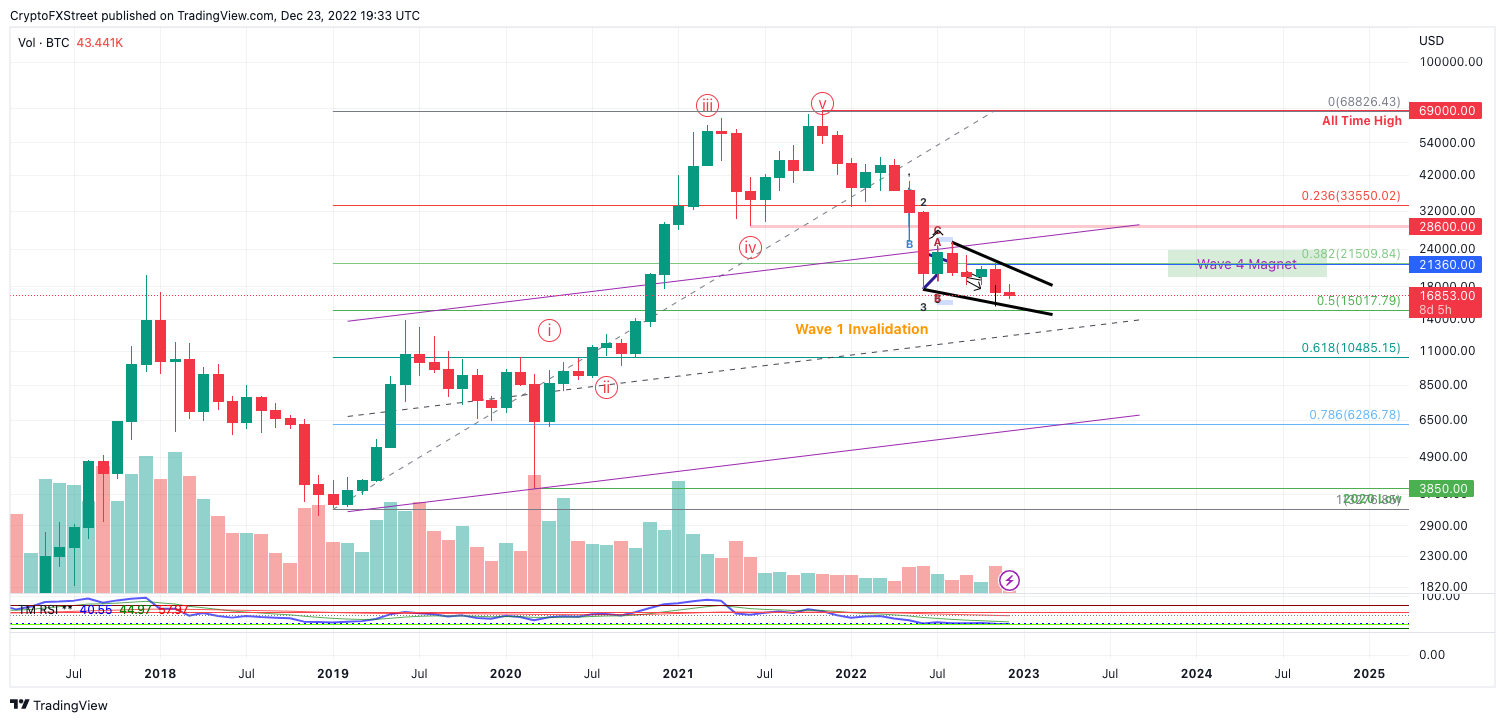
BTC/USDT 1-Day Chart
Ethereum price points south
Ethereum price is at a 68% loss of market value, matching Bitcoins 75% loss since all-time highs at $4,868. A Fibonacci retracement tool surrounding the pandemic lows at $86 and the all-time highs at $4,868 shows the current price hovering above the 38.2% retracement level.
Ethereum price trades at $1,276 and consolidates within a contracting range. The resolve from the squeezing price action could be a downtrend spike into the 50% ($645 )and 61.8% ($401) Fib levels sometime in the coming months. The bearish scenario creates the potential for up to a 65% decline from Eth's current market value without invalidating Wave 1 of the Macro Count at $366.80.
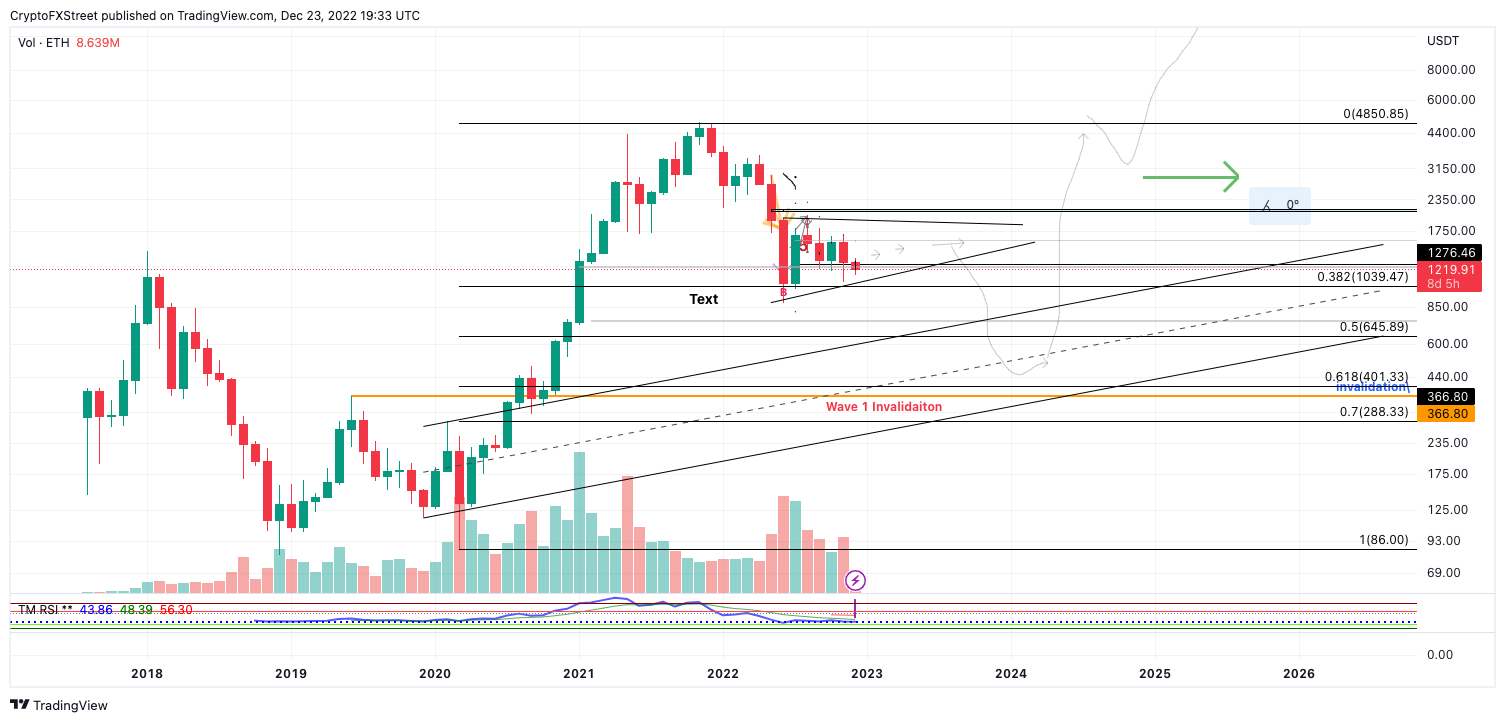
ETH/USDT 1-Day Chart
Based on Elliott Wave Theory, As long as Wave 1 remains unbreached, ETH still has the potential for one more Crypto rally in the years to come. A second bullish attempt at the All-time highs would yield a 280% increase from the current market value. Thus the $366.80 level can be used as a marker while investing with a dollar-cost average approach.
XRP price aims for the range low
XRP price is down 60% on the year and 81% below the all-time highs at $1.98.
While Elliot Wave provides a cleaner narrative for Bitcoin and Ethereum, Ripple's technicals seem more challenging to apply a macro count. XRP price has experienced turbulent swings in both directions since the pandemic lows at $0.1735. Still, classical technical analysis shows the possibility for a decline into the $0.20 zone.
XRP price is trading at $0.352 as the digital remittance token has fallen back into the midpoint of the 2022 summertime range. The low end of the range lies at $0.30, and the upper bounds are at $0.47, which creates the potential for a 20% decline and up to a 40% increase in market value.
A Fibonacci retracement tool surrounding the aforementioned range shows the golden pocket 61.8% level at $0.35 just below the current auctioning price. Based on Auction Market Theory, a puncture of the barrier could catalyze the 20% sweep of the lows liquidation.
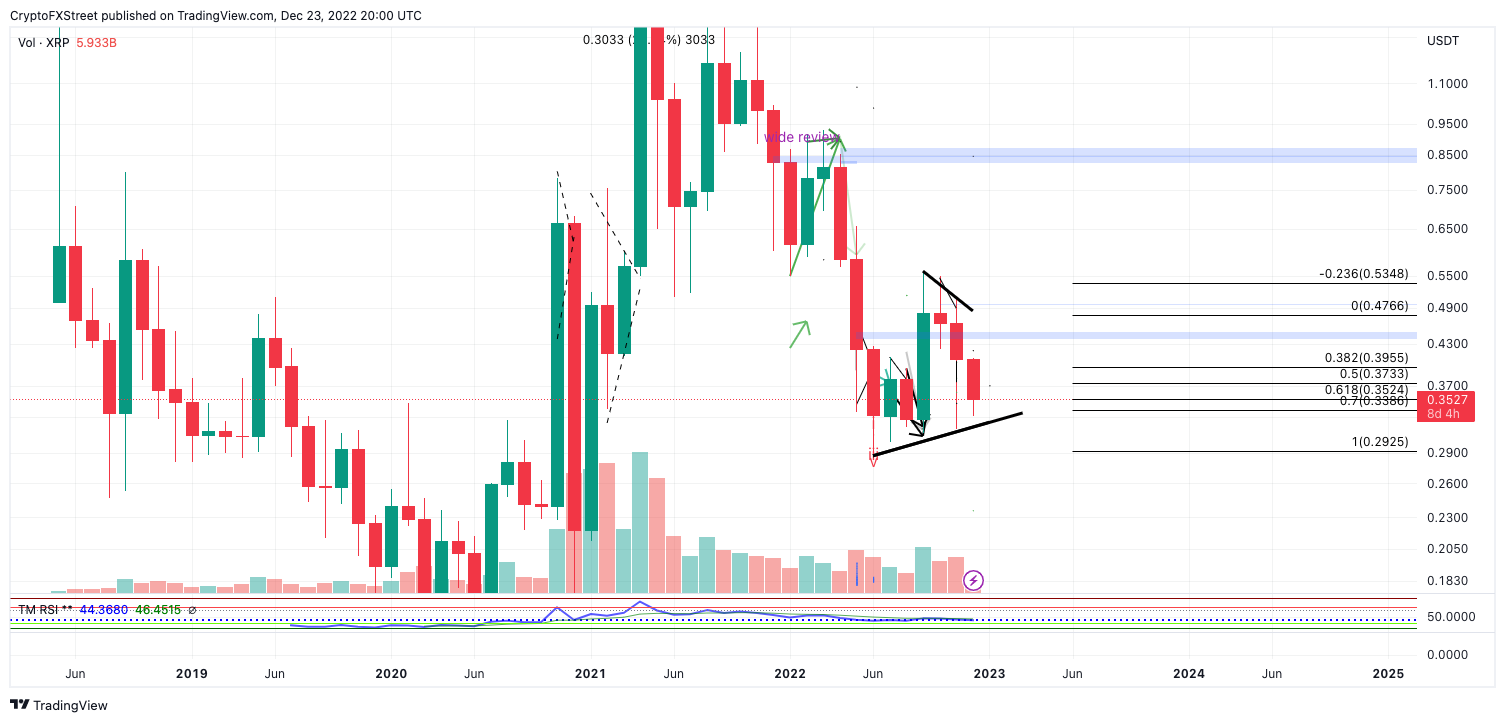
XRP/USDT 1-Month Chart
On the weekly time frame, the bears control the trend. The bulls need to reconquer the previous week's trading range at $0.41 to create more uptrend possibilities.
Author

Tony M.
FXStreet Contributor
Tony Montpeirous began investing in cryptocurrencies in 2017. His trading style incorporates Elliot Wave, Auction Market Theory, Fibonacci and price action as the cornerstone of his technical analysis.


