Top 3 Price Prediction Bitcoin, Ethereum, Ripple: First signs of an anticipated pullback
- Bitcoin price is down 2.5% on the day, but the trend remains bullish.
- Ethereum price has declined by 5% and could be the first sign of a deeper decline.
- XRP witnesses a 3.5% downswing and shows room for more sell-offs.

The crypto market is witnessing an influx in bearish activity. Key levels have been defined to forecast where the top three cryptocurrencies may be priced going into February.
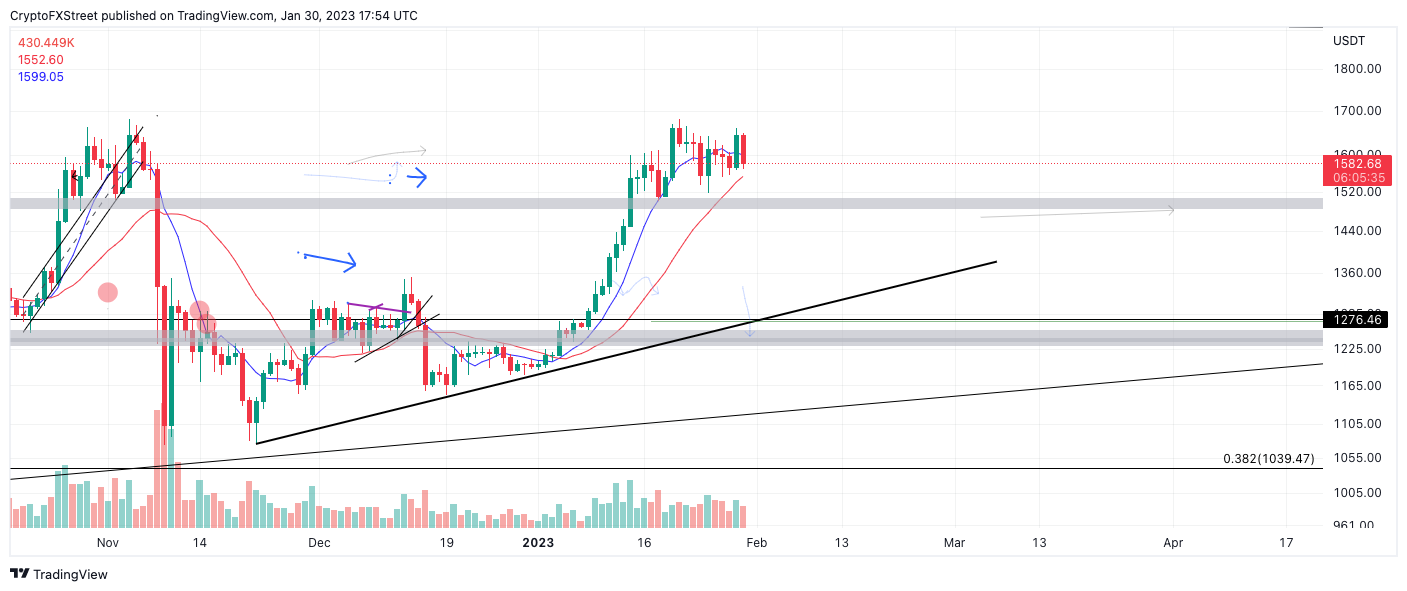
Bitcoin price down but not dead
Bitcoin price is witnessing resistance near the mid-$23,000 area. Since January 1, the digital currency has rallied by 45% in a jaw-dropping fashion. Throughout the surging trend, the BTC price has pulled back only for a day or so before continuing its ascension. On January 30, the BTC price witnessed its largest solo drop for the month. At the time of writing, the Bitcoin price registers a 2.5% decline in market value.
Bitcoin price currently auctions at $23,165. Although the largest red day is no worthy change in market behavior, several factors portray that BTC is still in a healthy uptrend. For instance, the bears have yet to produce a settling price beneath the average. The 8-day exponential moving average (EMA) often provides support for a trend during the third impulsive wave, also known as the strongest part of the rally. A candlestick close beneath the barrier usually results in a steeper three-wave correction, known as wave four.
The Volume Profile indicator correlates with the moon-shot narrative as the bulls remain in control according to the Binance exchange API. Despite all of the bears' attempts throughout the month, the strongest candle belongs to the bulls, with an influx of $454,000 transactions occurring on January 12.
Combining all of these factors, Bitcoin price is still on an uptrend until market conditions change. The next bullish targets are likely liquidity levels between $24,000 and the mid-$24,000 zone. The bullish scenario creates the potential for a 6% rise from the current BTC price.

BTC/USDT 1-Day Chart
Invalidation of the bullish thesis could occur if the bears produce a closing candlestick beneath the 8-day EMA at $23,000. In doing so, the bears could reroute south and test previous resistance zones near $21,000, resulting in a 7% decline from Bitcoin's current market value.
Ethereum price starting phases of a sell-off?
Ethereum price is witnessing a strong backlash after a 4% rise during the final Sunday of January. The bears have fully reversed the move tagging the opening price at $1,572, prompting a 5% decline on the day. As mentioned in previous outlooks, the $1,610 zone is crucial for the ETH's uptrend and failing to hold the price action above could catalyze a strong move to the downside.
Ethereum price currently auctions at $1,583. Like Bitcoin, the Volume indicator remains in the bulls’ favor. However, the bears have produced a daily candlestick close beneath the barrier on previous attempts during the uptrend. The back-and-forth price action near the $1,610 zone could be traders wrestling for the position in anticipation of a liquidation event.
The bearish scenario creates the potential for a 15% decline in ETH price into the $1,350 target.
ETH/USDT 1-Day Chart
A daily candlestick close above $1,610 is needed to invalidate the bearish thesis. In doing so, the bulls could be back on track to target the $1,700 liquidity zone, resulting in an 8% increase from Ethereum's current market value.
XRP price merits concern
XRP price shows reasons to be concerned as the bears appear to be taking control of the 7-day consolidation phase. On January 30, the digital token is down 3.5% on the day as the bears accomplished their first breach of the 21-day simple moving average (SMA). If the SMA does not hold the support, investors can expect the mid-$0.30 zone to be retested in the coming days.
XRP price currently auctions at $0.3995. A Fibonacci retracement tool surrounding the entirety of Ripple's 42% rally in January shows the current price point as just a 23.6% correction. Fibonacci traders argue that the 23.6% point is not a significant reversal level. Thus, the sell-off could continue. A breach at the 50% Fib level marked $0.362 would result in a 9% decline from XRP's current market value.
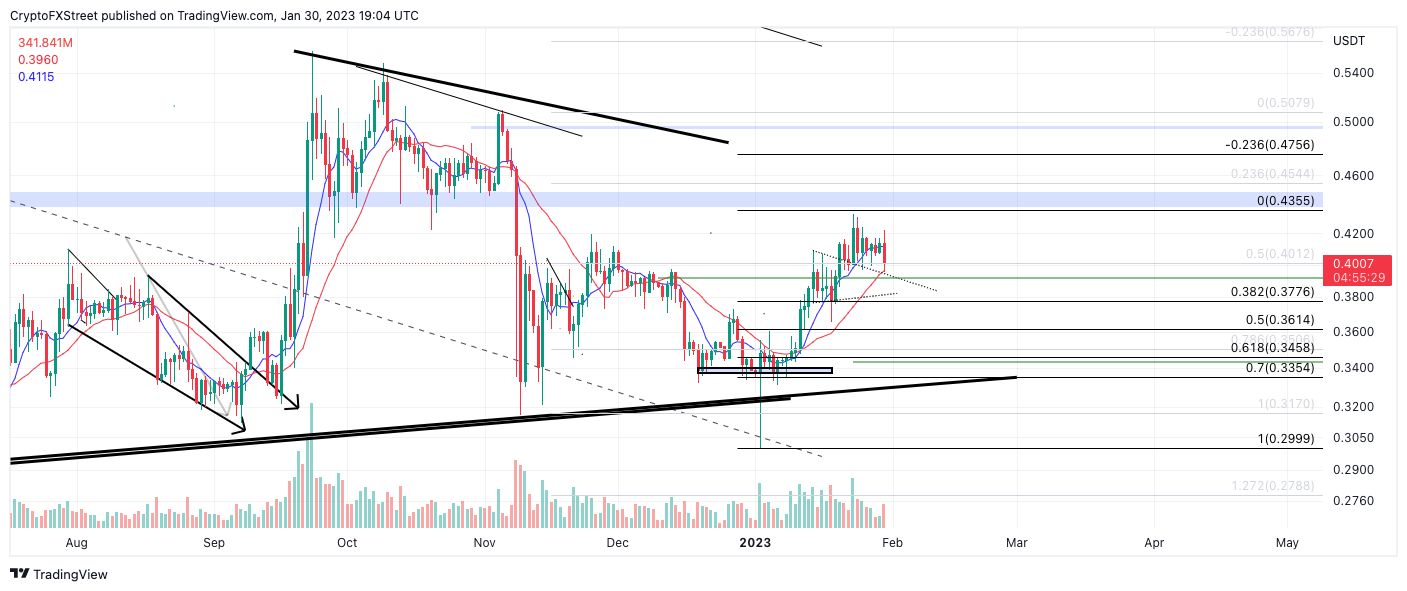
XRP/USDT 1-Day Chart
For traders looking to enter the market, a bearish invalidation point can be placed above the $0.43 swing high established on January 23. A breach of the barrier could trigger a rally toward the $0.45 liquidity zone, which would result in a 12% increase from the XRP current price.
Author

Tony M.
FXStreet Contributor
Tony Montpeirous began investing in cryptocurrencies in 2017. His trading style incorporates Elliot Wave, Auction Market Theory, Fibonacci and price action as the cornerstone of his technical analysis.


