Top 3 Price Prediction Bitcoin, Ethereum, Ripple: Volatility calling for a trade-per-trade outlook
- Bitcoin price rallies into the $23,000 price zone.
- Ethereum price traps bear beneath $1,600.
- XRP price is up 2% on the day and could rally an additional 7%.

The crypto market has broken its five-day consolidation to the upside. Key levels have been identified to gauge where cryptocurrencies may find resistance moving forward.
Bitcoin price back within the range
Bitcoin price currently auctions at $23,084, as profit is being taken on smaller time frames after rallying 5% earlier in the day. While the bulls have accomplished a new high on the month at $23,816, the daily settle has closed within the previous five-day range. The retracement could suggest problematic market behavior in the days to come.
It is evident now that the BTC faces significant resistance near $24,000. Since BTC is already up 40% since January 1, traders may want to move their stop losses higher to secure profits in the event of a stronger decline. A second attempt at the daily low at $22,300 could catalyze a stronger move to the downside with key targets at $20,719 and $19,695. The best bearish scenario creates the possibility for a 15% decline from Bitcoin's current market value.
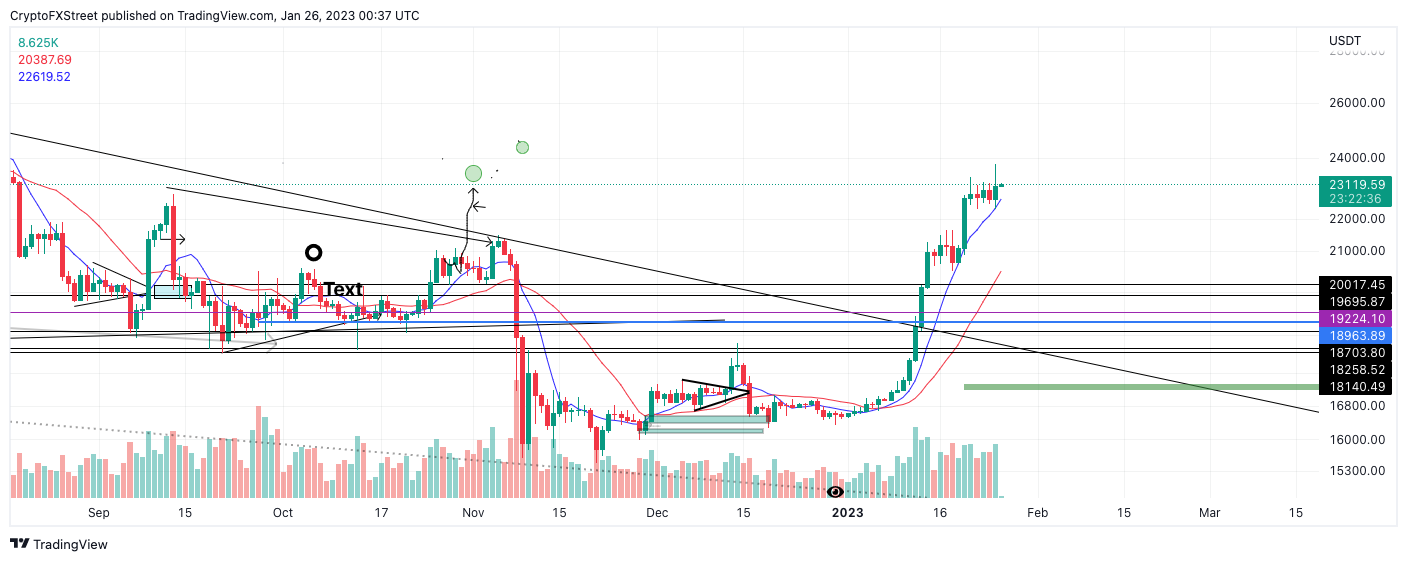
BTC/USDT 1-day chart
On the contrary, a daily close above $24,000 could signal more uptrend potential. Key levels of interest would be the $24,800 and $25,400 liquidity zones. BTC would rise by 10% if the bulls were to succeed.
Ethereum price wipes out liquidity
Ethereum price witnessed the largest red day in 2023 as the decentralized smart contract token fell by 4% on January 23. Since the breach, the ETH price has pulled off an impressive 180, rallying by 5% and reconquering the $1,600 zone.
Ethereum price currently auctions at $1,623. The back-and-forth price action is sure to trap traders on one side of the market. Currently, the bears are holding more risk as the January 25 auction settled with a 5% gain above the 8-day exponential moving average.
The next trade will likely propel ETH into the $1,700 zone, resulting in an additional 7% increase in market value.
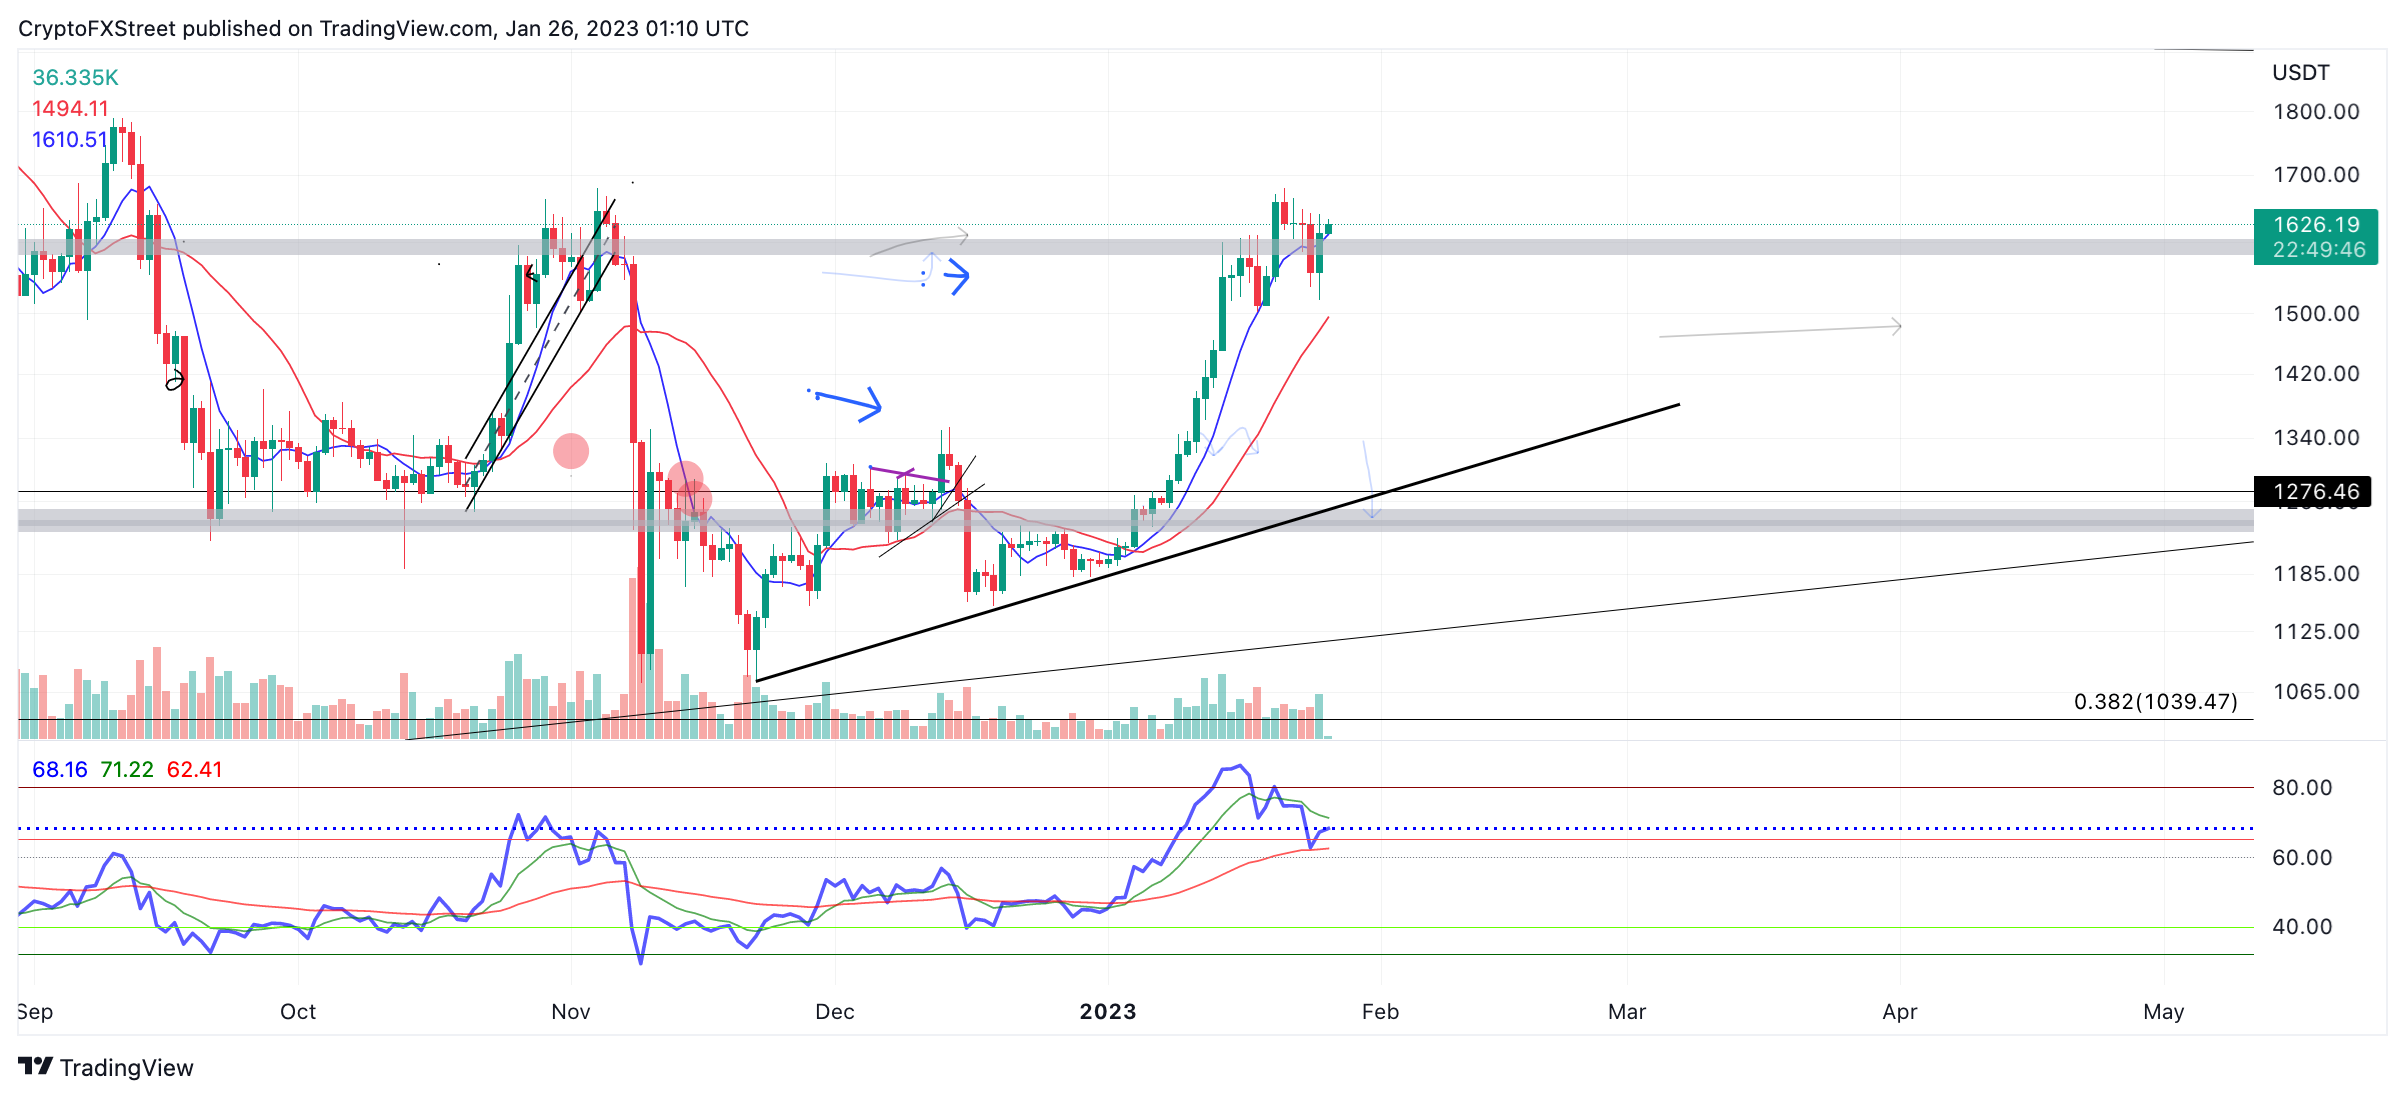
ETH/USDT 1-day chart
Invalidation of the bullish trade idea could arise from a sweep of the recent low at $1,523. A second attempt at the low would lead to a much stronger decline targeting the 21-day simple moving average at $1,490, and potentially the $1,400 barrier. The Ethereum price would decline by 15% under the bearish scenario.
XRP price has a decision to make
XRP price Is up 2% on the day as the bulls have bounced from a previous resistant trend line. The breached trend, which acted as resistance between January 14 and January 20 when XRP traded at sub-0.400 price levels, provided cushion space for bulls to enter the market during an early afternoon sell-off on January 25.
XRP price currently auctions at $0.415. At the current time, the back-and-forth price action this week is a firm signal that the market will witness a strong move in the coming days. If the direction is north, the Ripple price will tag November's broken support zone at $0.440. The bullish scenario creates a potential 7% spike from XRP's current market value.
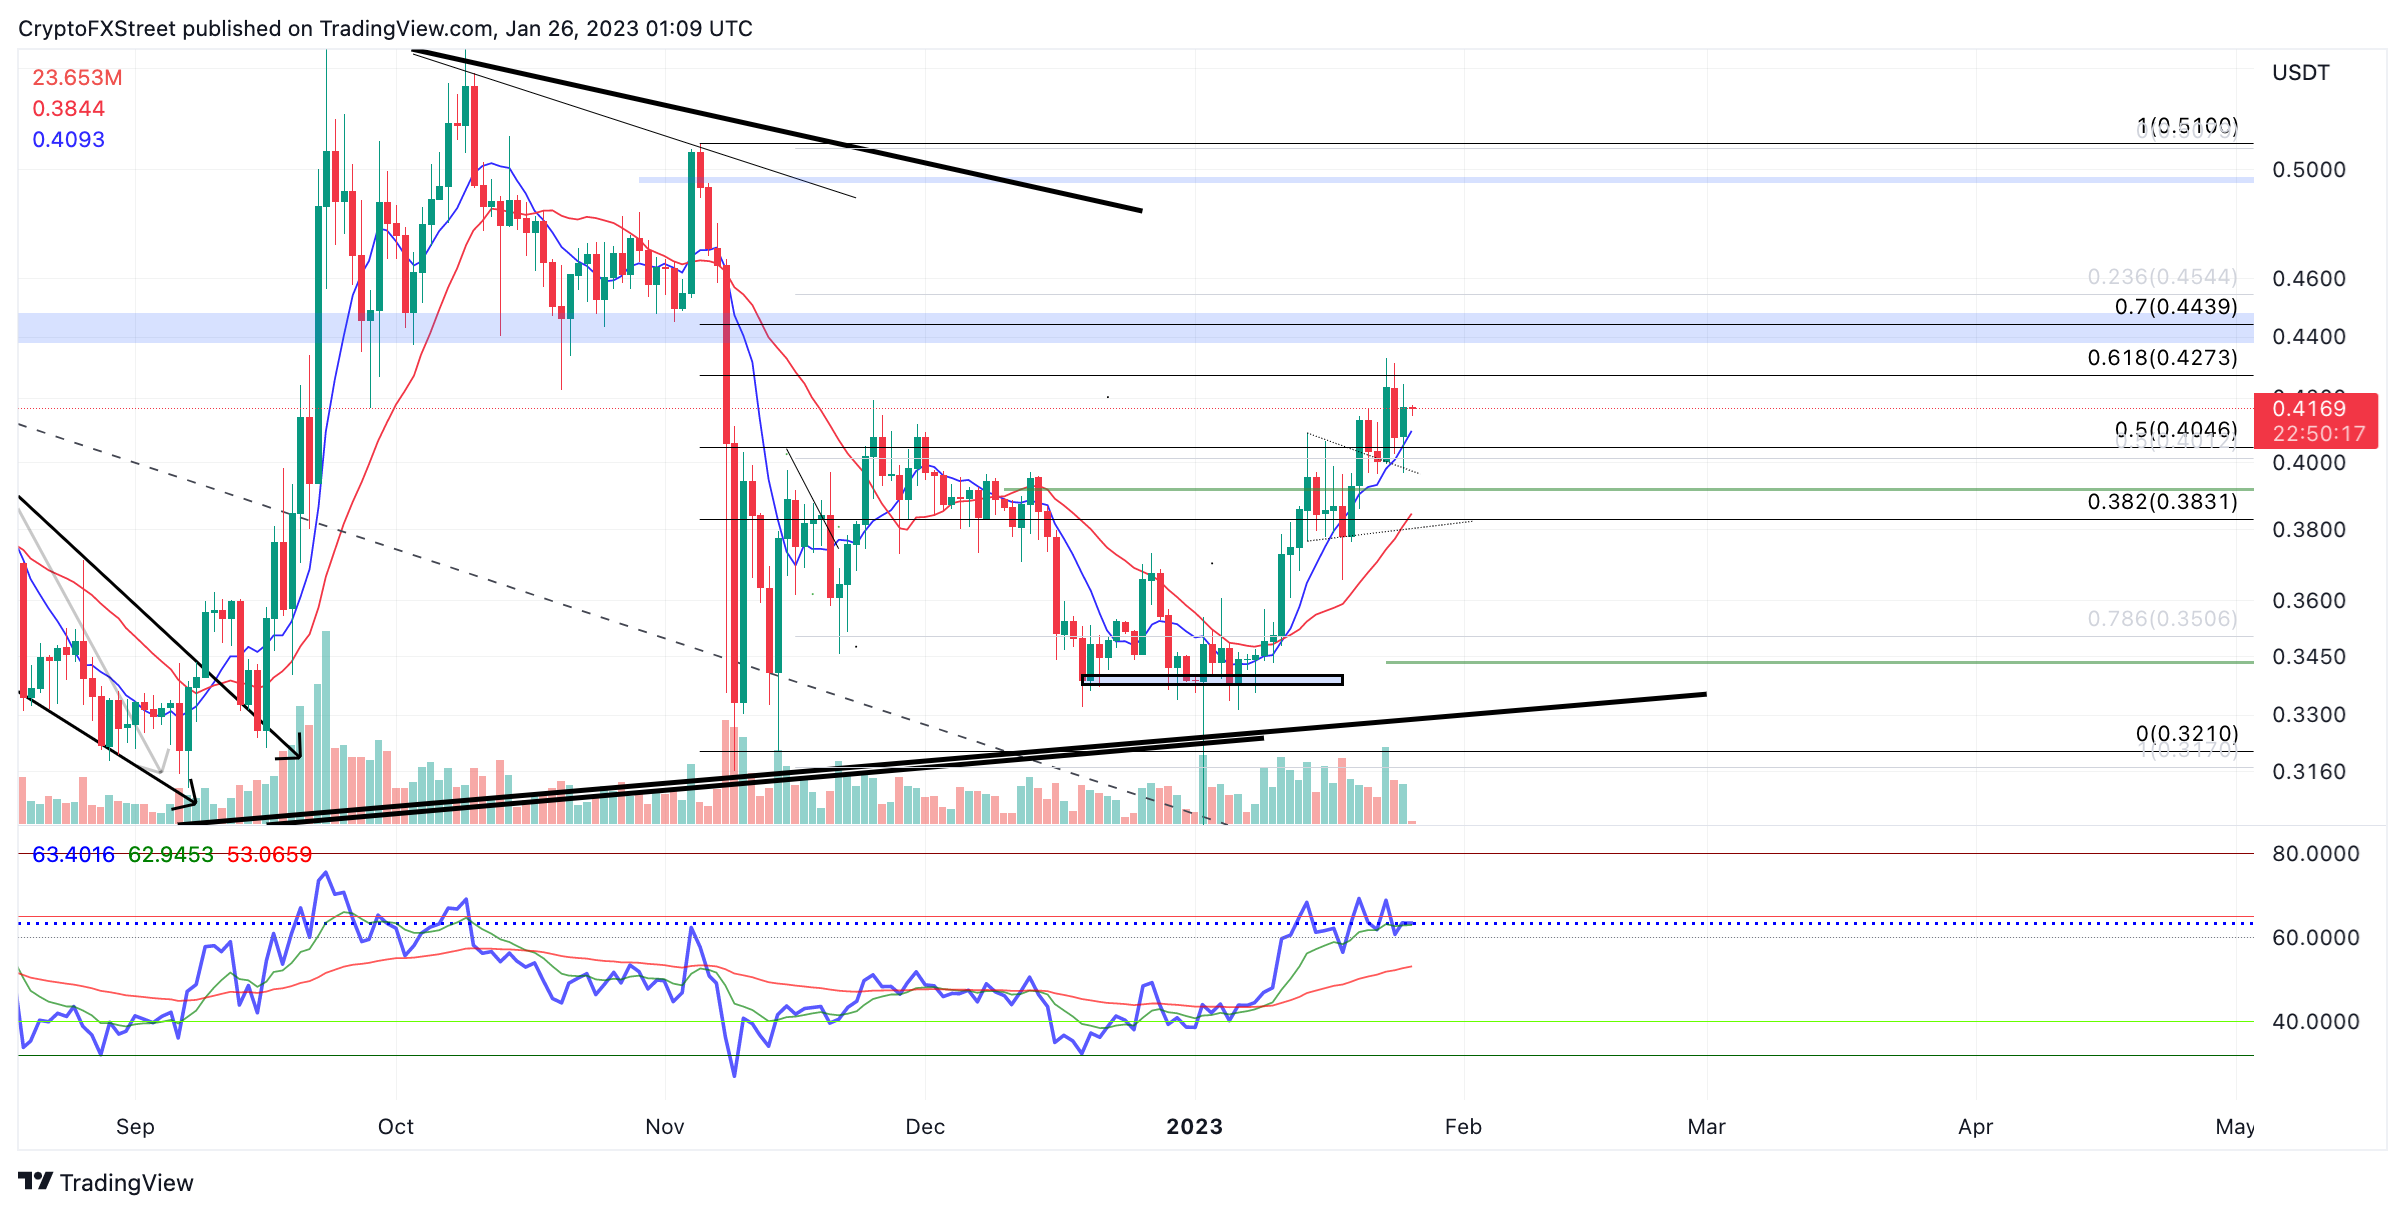
XRP/USDT 1-day chart
On the contrary, a second attempt at the current daily low at $0.396 could trigger a cascade of selling. Traders should look for support levels to step in near the 21-day simple moving average at $0.381 and $0.375 as a second target. The bears would forge a 15% dip in market value if successful.
Author

Tony M.
FXStreet Contributor
Tony Montpeirous began investing in cryptocurrencies in 2017. His trading style incorporates Elliot Wave, Auction Market Theory, Fibonacci and price action as the cornerstone of his technical analysis.



