Top 3 Price Prediction Bitcoin, Ethereum, Ripple: A trading plan to kickstart February
- Bitcoin price undergoes the seventh day of consolidation near the $23,000 price level.
- Ethereum price finds resistance at $1,610.
- XRP price remains range-bound at the $0.41 zone.

The Crypto market is undergoing a time-consuming consolidation that is likely to resolve in a volatile move. Key levels have been defined to forecast the markets’ potential trajectory.
Bitcoin price in consolidation mode
Bitcoin price is finding resistance near the mid-$23,000 price zone. While the bullish rally has been impressive already, traders viewing the current consolidation as a weakening trend may be overlooking a few details.
Bitcoin price currently auctions at $23,146. During the week-long consolidation, the Bitcoin price has produced higher highs progressively. On January 25, the Bulls produced a new monthly high at $23,816 after finding support from the 8-day exponential moving average.
So long as BTC can sustain itself above $23,000, the bulls should continue aiming for higher targets. The next key level of interest is the $24,000 zone, followed by the $24,650 liquidity level. The bullish trade idea creates a potential 7% upswing from the current BTC price.
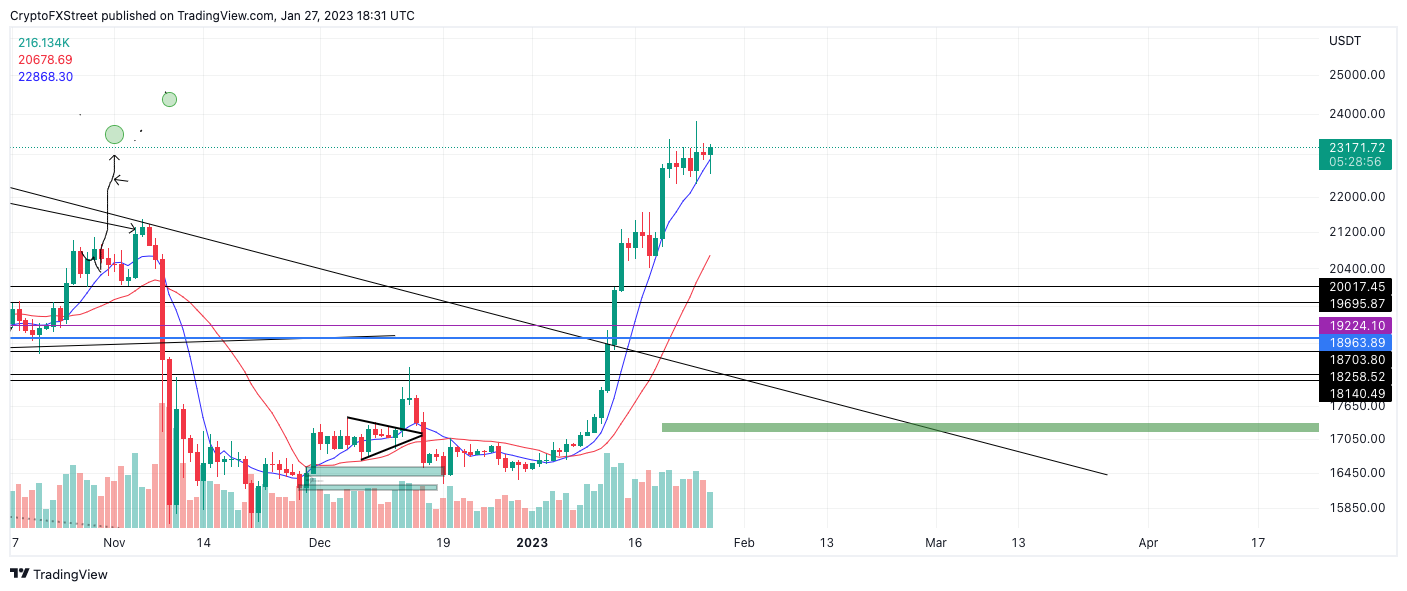
BTC/USDT 1-Dayn Chart
As mentioned, a breach of the 8th-day exponential moving average to the downside would be a justified entry for sidelined bears. If the breach occurs, the 21-day simple moving average, which has remained untested throughout the 40% rally, would be a key level to aim for. The bears would accomplish a 10% decline if successful.
Ethereum price faces resistance
Ethereum price shows similar technicals to Bitcoin with one slight variable. Ethereum witnessed a seven-day consolidation last week at the mid-$1600 zone until January 23, when the bears successfully breached the 8-day exponential moving average. The liquidation caused a momentary loss at the $1,600 support zone. Since the sell-off, the bears have maintained their power, forging a new wall of resistance near $1610.
Ethereum price is currently auctioning at $1603, and going on the fifth consecutive day being rejected at the $1610 resistance barrier. Traders should pay keen attention to this level throughout the weekend as a smaller time frame candlestick close above the barrier could trigger a massive buying frenzy.
If a breach above $1610 occurs, a $1700 Ethereum will likely become a new reality. Invalidation of the uptrend move would be a breach below the recent swing low at $1552.
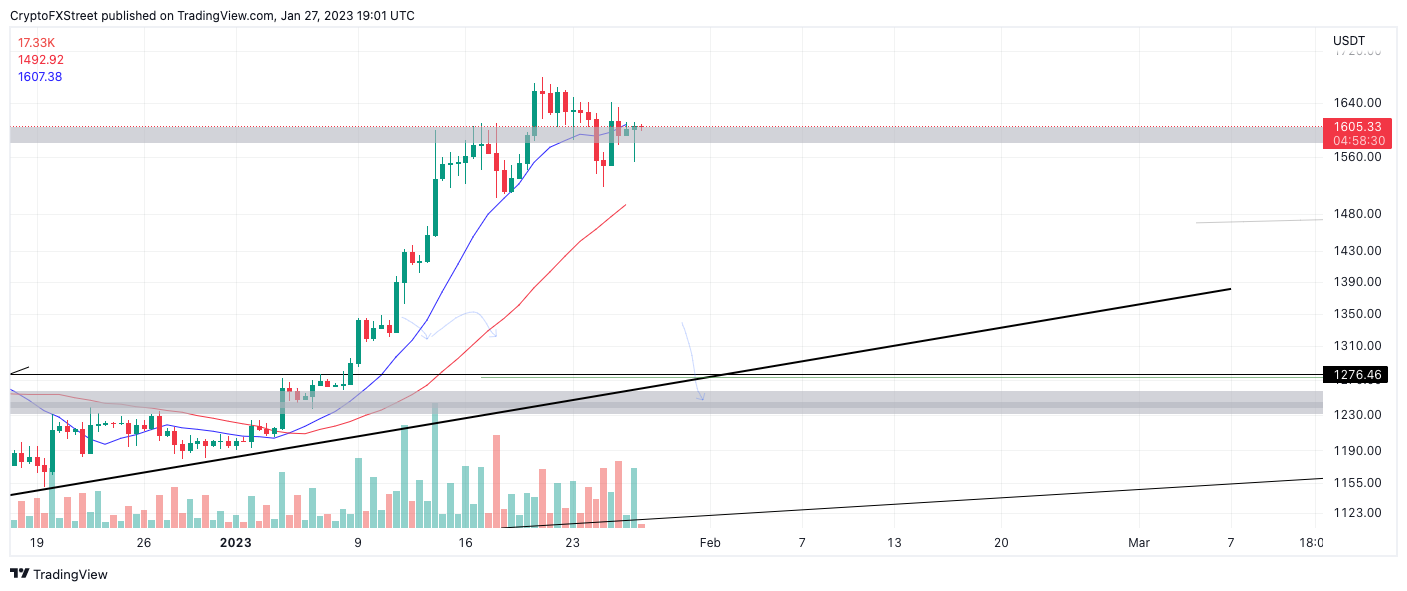
ETH/USDT 1-Day Chart
On the contrary, if the bears continue their flex, ETH could descend into much lower targets. The first area of inerest would be the 21-day simple moving average at $1480, followed by a plummet into the ascending trendline at $1250. The ascending trend line remains untested after providing crucial support for the 40% uptrend during its’ initial stages of growth.
XRP price shows turbulence
XRP price witnessed a countertrend pullback after falling 3% earlier in the day. While the technicals are optimistic, traders should continue to practice risk management as Ripple’s market behavior have been far from concise this week.
XRP currently auctions at $0.41. The back-and-forth pullbacks within the low $0.40 zone is telling of the underlying sentiment around the digital remittance token. The choppy price action is forcing day traders to look for other opportunities in the market, while investors with a longer-term swing trade approach still await a decision from the ongoing SEC vs. Ripple feud.
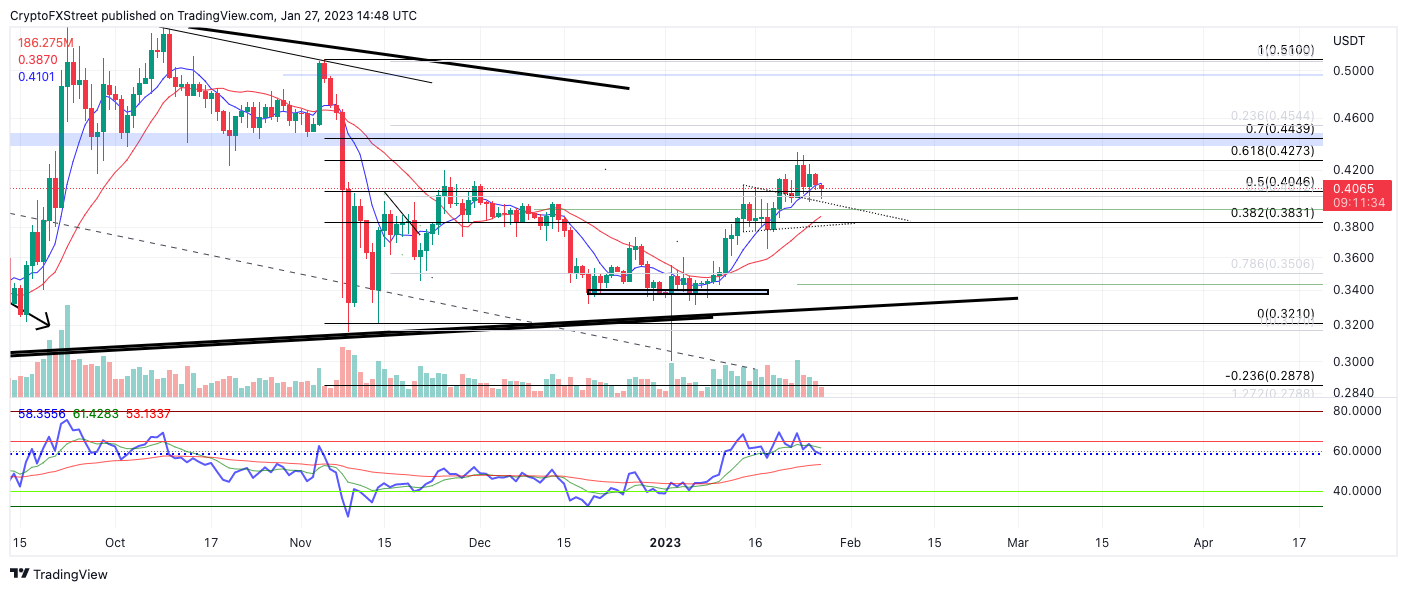
XRP/USDT 1-Day Chart
Based on recent market behavior, this thesis remains neutral. A breach above the recent high at $0.428 will give way to a rise toward the broken support zone at $0.44. However, a second attempt south past the $0.395 support level could induce a decline targeting $0.375. Both scenarios would result in a 10% swing in either direction.
Author

Tony M.
FXStreet Contributor
Tony Montpeirous began investing in cryptocurrencies in 2017. His trading style incorporates Elliot Wave, Auction Market Theory, Fibonacci and price action as the cornerstone of his technical analysis.


